Hope everyone already knows how to read the market trend with the use of moving averages and once an AOTS is formed then we expect for a bull run, if you have an inverted AOTS then you know its a bear trend.
In case one doesn't want to use the AOTS formation then simply one may adapt Minervini moving averages of 30,40,150,200 to scout your stocks.
Let me then share with you an old tool used by traders as well as investors perhaps which is the Fibonacci retracement which is very helpful in terms of finding possible support (pullback) and resistance (target price).


Most of the time I read from groups or forum where traders asking these similar questions like the ff:
"Mga boss ano TP naten sa PXP?"
"TP niyo sa ION?"
" Pull back na ba? Pwede na bumili?"
"Healthy pull back mga pre, dagdag na ng shares?"
For those who are new to Fibonacci here's a short tutorial to get started just open your chart and follow instructions below.
To add the Fibonacci retracement from your chart simply look for the Pitchfork icon and scroll to Fib retracement. (Click images below to view its full size)
 |
| Pitch_fork_icon |
Once you click on Fib Retracement you will simply click on your starting point and drag from left to right always either starting from low to high or from high to low.
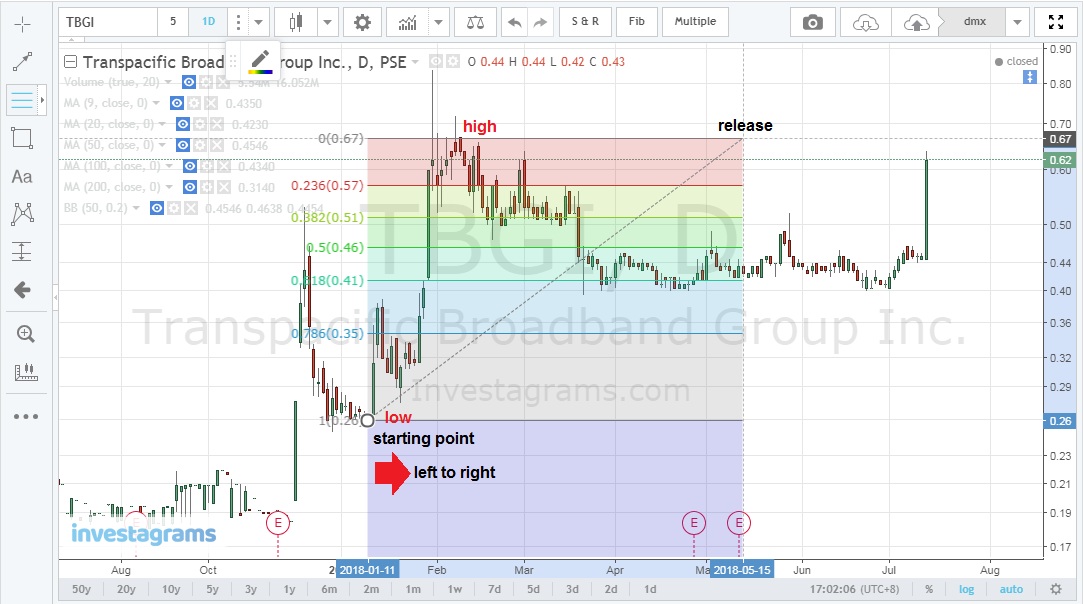 |
| chart_from_investagrams |
You may simply click on Fib retracement and click on cog icon (settings) to make any changes on colors, coordinates etc to your own liking.
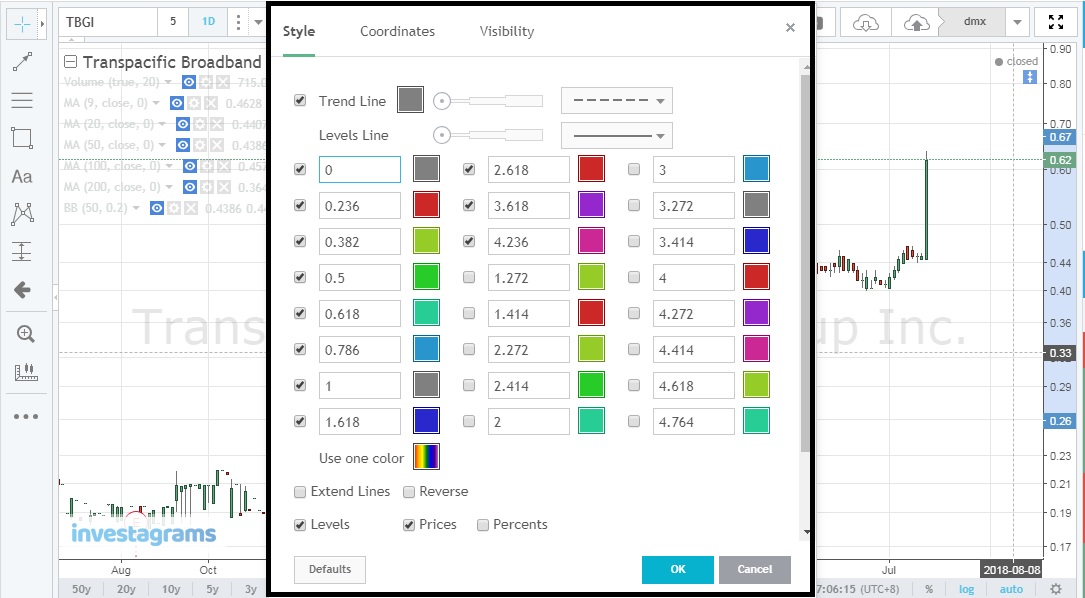 |
| chart_from_investagrams |
Changing exact values of prices for your starting point and end point under coordinates.
 |
| chart_from_investagrams |
Now that you are ready with your Fib retracement most traders advise is to watch out for three levels 0.382, 0.50, and 0.618 but as I mentioned from my AOTS post you may also add 0.236 level as a base support when playing with stocks on breakout, if price won't hold at this level then the breakout momentum was not strong enough as mentioned by Stocksentinel.
Aside from using Fibo to determine support and resistance you may actually use it as your stop loss reference if it fails to hold on those support levels or resistance levels (since short selling is already approved).
Disclaimer: Sample charts provided are for educational purposes only.
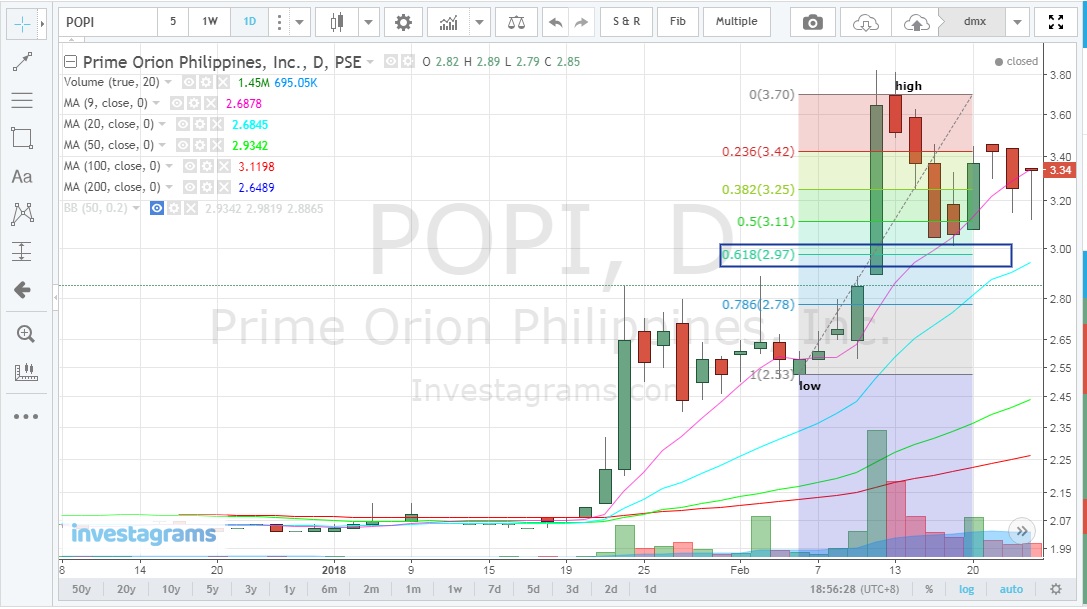
STOCK: POPI
note: I did not highlight much on 0.618 level just don't forget to keep watch on that level when you make your trades.
Swing your Fib Retracement from low to high to anticipate possible pullbacks (support) where price can bounce from these given levels, if not then do the necessary action plan for your trade.
 |
| chart_from_investagrams_price_reversed_at_0.50_level |
Take note that from the 0 level which is your "HIGH" you may use this as your trigger that once the price go beyond this level then its a breakout but make sure there is a decent volume involved else its a false breakout.
 |
| chart_from_investagrams_break_out_from_previous_high |
If you notice I did not consider the wick that broke above our previous high (from 0 level) since that is not a valid breakout according to one trader, make sure the body of the candle must close above 0 level to consider it as valid, plus volume present (refer to image above).
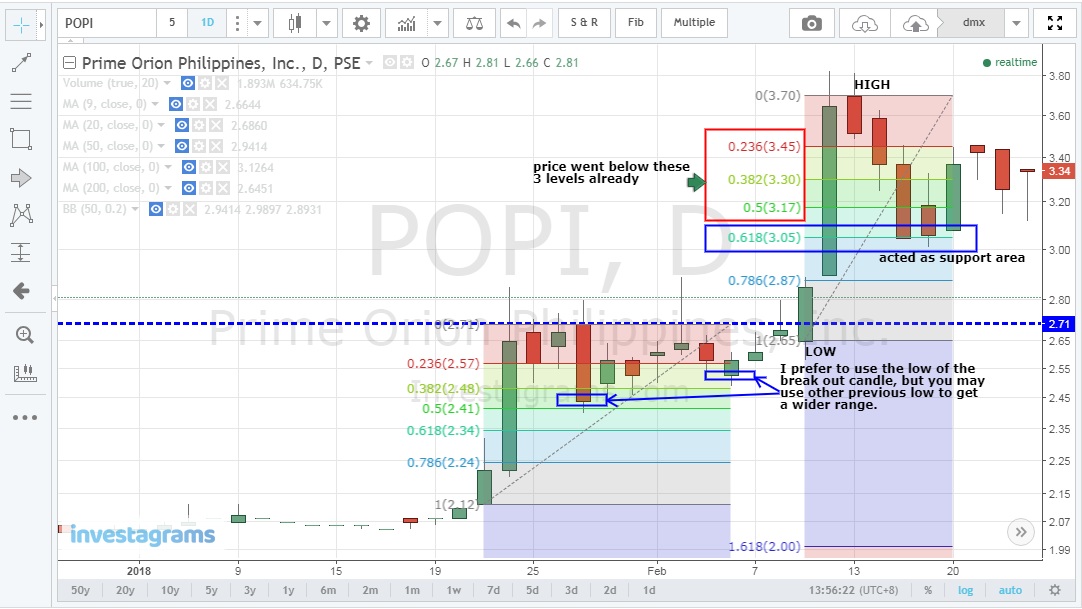
Looking at chart after the breakout, the support levels at 0.236 up to 0.50 did not manage to hold except from 0.618 level where price manifest a sign of reversal.
Looking at chart after the breakout, the support levels at 0.236 up to 0.50 did not manage to hold except from 0.618 level where price manifest a sign of reversal.
 |
| chart_from_investagrams_new_support_levels |
Sample image above I prefer to use the breakout candle "low" as my starting point (I disregard the wick always) to get new support levels but you may simply look for other lower lows as your starting point depending on your own preference.
Here's what it looked like if you try to use those two other previous "low" to establish your support levels it will somehow fall to our three watch list levels.
Here's what it looked like if you try to use those two other previous "low" to establish your support levels it will somehow fall to our three watch list levels.
 |
| chart_from_investagrams_using_previous_low_2.44 |
Now that I already have an idea on possible support areas since I am given with previous high (3.70) and low (3.05), I can simply plot in advance possible target prices (resistance) where traders may sell off and take profit.
This time around still starting from left to right simply swing from "high" to "low" to get possible TP (target price) or resistance as shown below.
This time around still starting from left to right simply swing from "high" to "low" to get possible TP (target price) or resistance as shown below.
 |
| chart_from_investagrams_anticipating_resistance_levels |
Sample image above shows sell off from 1.618 level and did not hold (nauntog) and started to drop the next day while you keep watch on 0.618, 0.50, 0.382, 0.236 levels if it can hold from these areas.
 |
| chart_from_investgarams_levels_breached |
The last line of defense of 0.236 did not manage to hold as shown above, and even after setting another Fibo Retracement from given previous high (3.85) to new previous low (2.96), it failed to break the resistance level at 0.786 (3.66) but a short lived touched at 0.618 before another sell down.
 |
| chart_from_investagrams_another_test_at_0.786_(3.66) |
After a failure at 0.786 level (3.66) another try to retest the resistance the following days but still ended up short with 3.64 as "high" and another sell down took place and while getting for new support levels, 0.618 failed to hold after a long sideways movement of price.
 |
| chart_from_investagrams_overall_from_first_fib_retracement |
Going back to our first Fib retracement origin somehow the price manage to stay above 0.236 level and acted as strong support before another reversal took place as shown above.
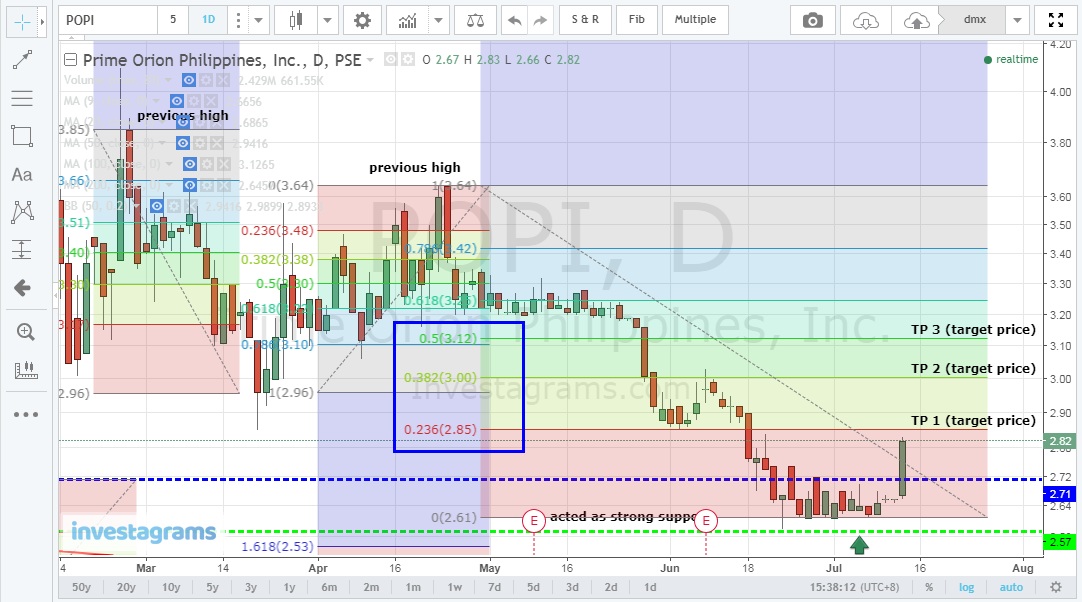
Now let's try to established another set of resistance levels for possible target price where sell off can happen as shown below (3.64 high to 2.61 low) at 2.85, 3.00, 3.12 levels.
Now let's try to established another set of resistance levels for possible target price where sell off can happen as shown below (3.64 high to 2.61 low) at 2.85, 3.00, 3.12 levels.
 |
| chart_from_investagrams_new_resistance_levels |
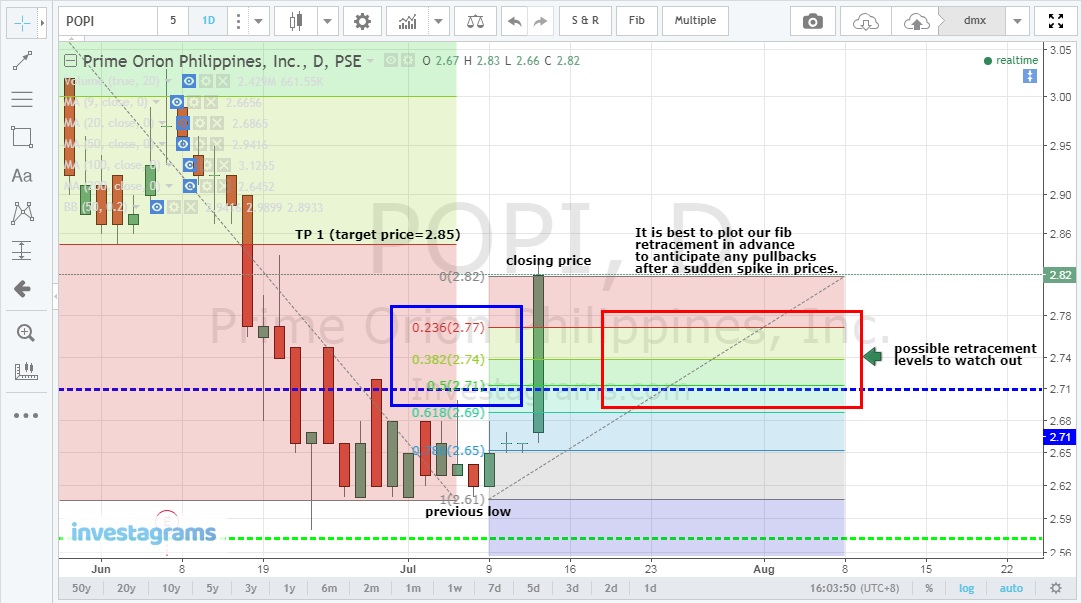
Finally trying to anticipate possible supports in case the momentum will not be able to sustain its strength. (2.61 low to 2.82 high) with supports 2.69, 2.71, 2.74, 2.77 levels as shown below.
 |
| chart_from_investagrams_possible_support_levels |
Just a follow through to POPI as of July 16, 2018 so far almost our projected resistance levels and supports where already hit now we just have to make some adjustments based from new highs.
STOCK: TBGI
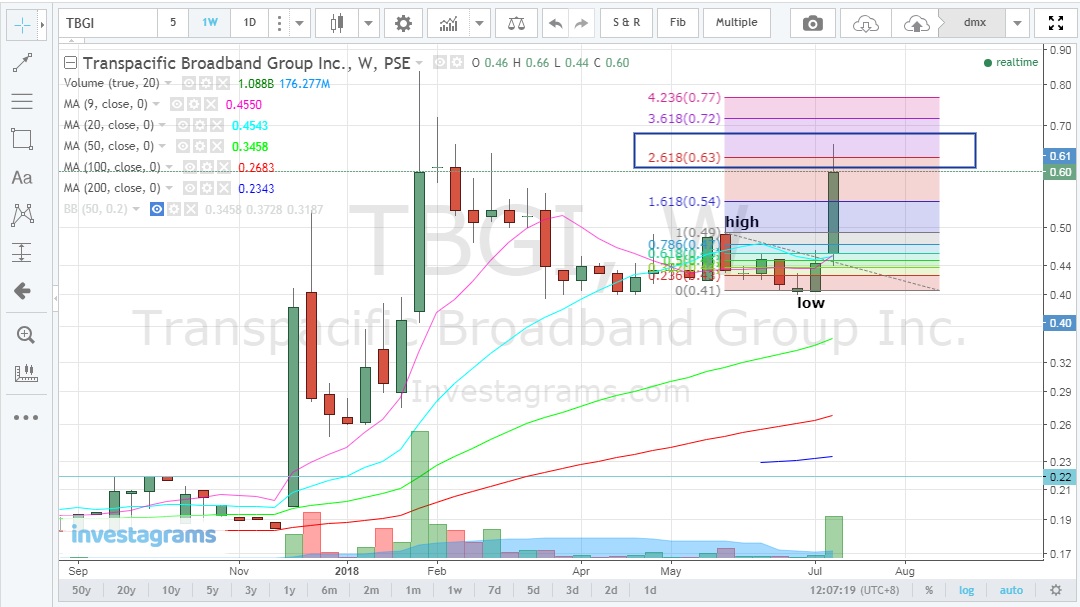
Let's take a look at a weekly chart for TBGI to find resistance, based from sample chart below it happened that 2.618 level is hard to break.
 |
| chart_from_investagrams_adjusting_support_and_resistance_levels |
STOCK: TBGI
Let's take a look at a weekly chart for TBGI to find resistance, based from sample chart below it happened that 2.618 level is hard to break.
 |
| chart_from_investagrams_tbgi_weekly_chart_time_frame_chart_01 |
Moving our Fib retracement to our new previous high(0.61) and previous low(0.41) to get our new resistance level at 1.618 (0.73) that price needs to break.
 |
| chart_from_investagrams_new_set_of_previous_high_and_low_chart_02 |
Moving further with our previous high(0.49) and previous low(0.41) will give you resistance level at 2.618 (0.63) which is almost the same as to our very first Fib retracement if you go back to our original Fib chart 01 above.
 |
| chart_from_investagrams_adjusting_fib_retracement_chart_03 |
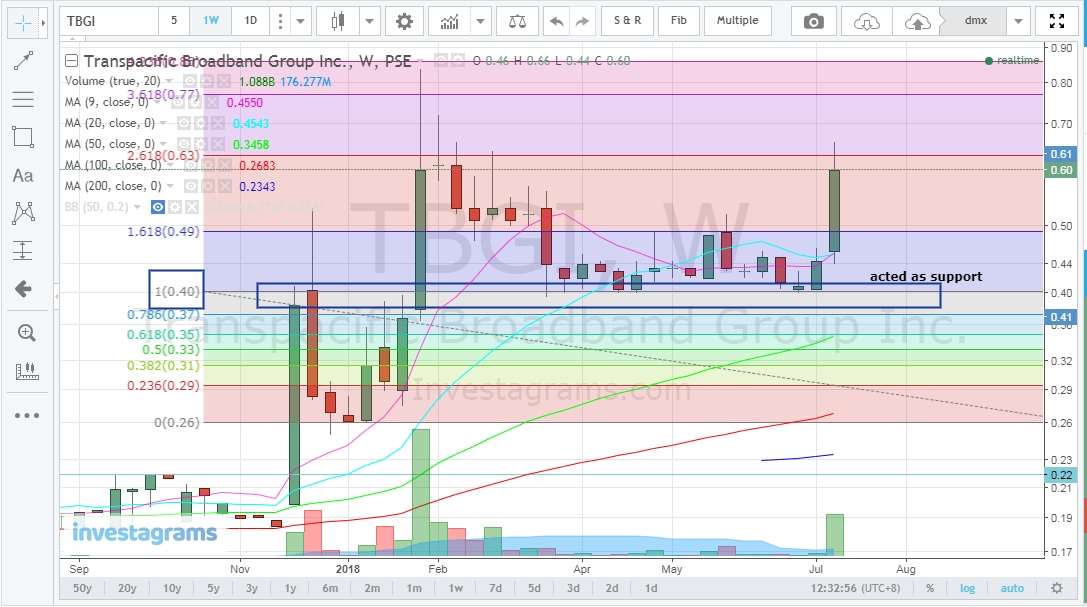
You may also be interested by just looking at our first Fib retracement at chart 01 that 0.40 price was able to hold and acted as your support.
 |
| chart_from_investagrams_strong_support_along_0.40_price |
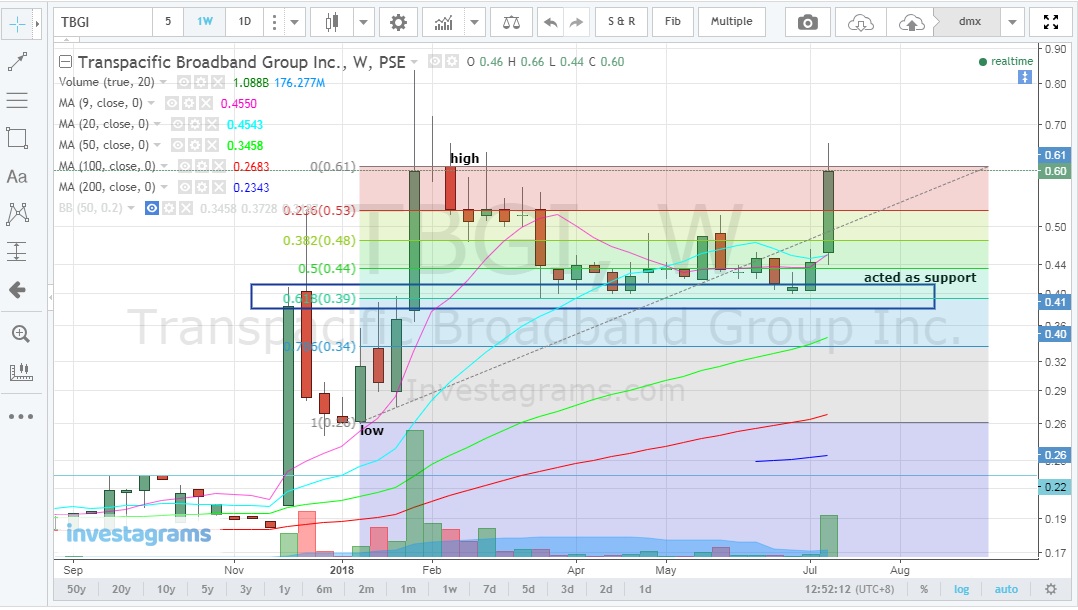
To check this we will apply again Fib retracement but this time starting from low(0.26) to high(0.61) to get support levels and true enough it manage to stay above 0.618 level.
 |
| chart_from_investagrams_swing_from_low_to_high_to_establish_support_levels |
As mentioned Fib retracement can also be used to help you get some hints if its near to make a breakout if price close above your previous high.
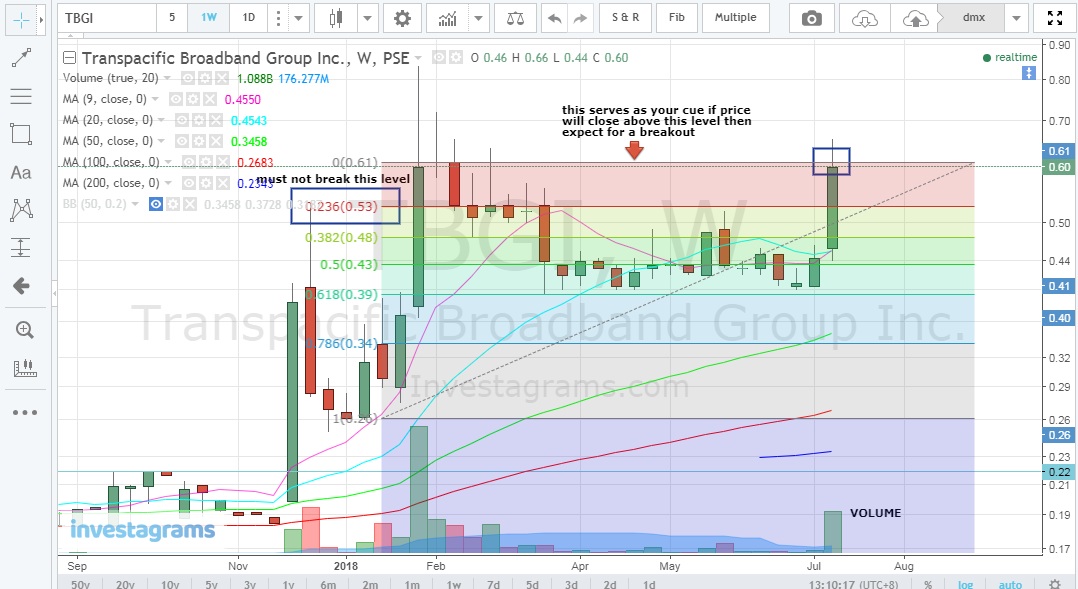 |
| chart_from_investgrams_watch_out_for_break_outs |
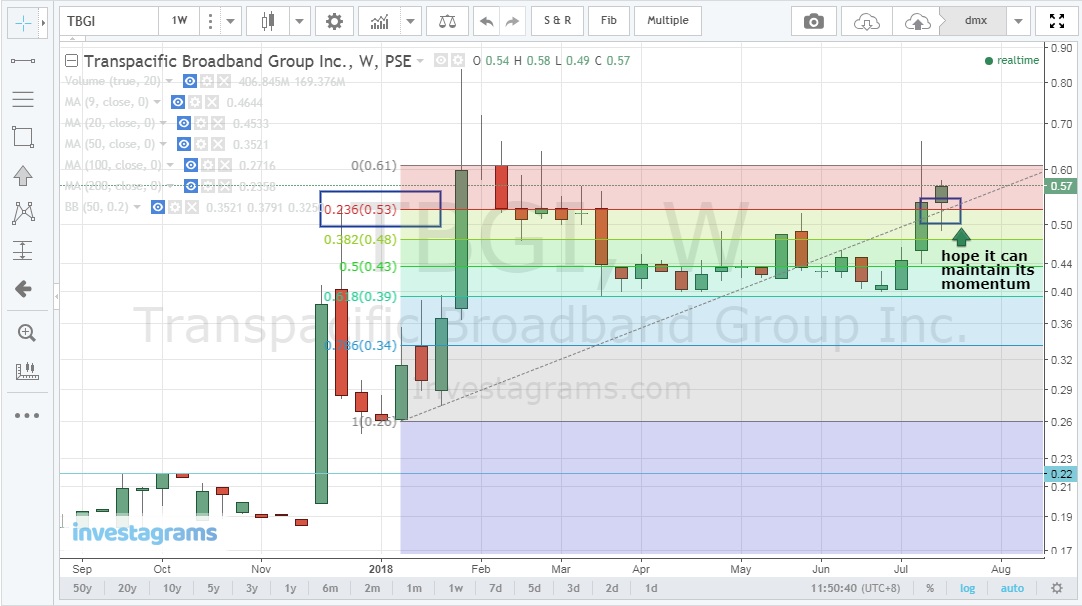
Chart as of July 16, 2018 for TBGI in weekly time frame.
 |
| chart_from_investgrams_line_of_defense_for_your_support |
Chart as of July 20, 2018 showing some signs of life as we observe if it can maintain its momentum.
STOCK: TUGS
Finding its resistance levels using high (5.98) and low (3.02)
 |
| chart_from_investgrams_holding_above_0.236_level |
STOCK: TUGS
Finding its resistance levels using high (5.98) and low (3.02)
 |
| chart_from_investgrams_tugs_possible_resistance |
Finding its support levels using low (3.02) and high (3.62) as of the moment
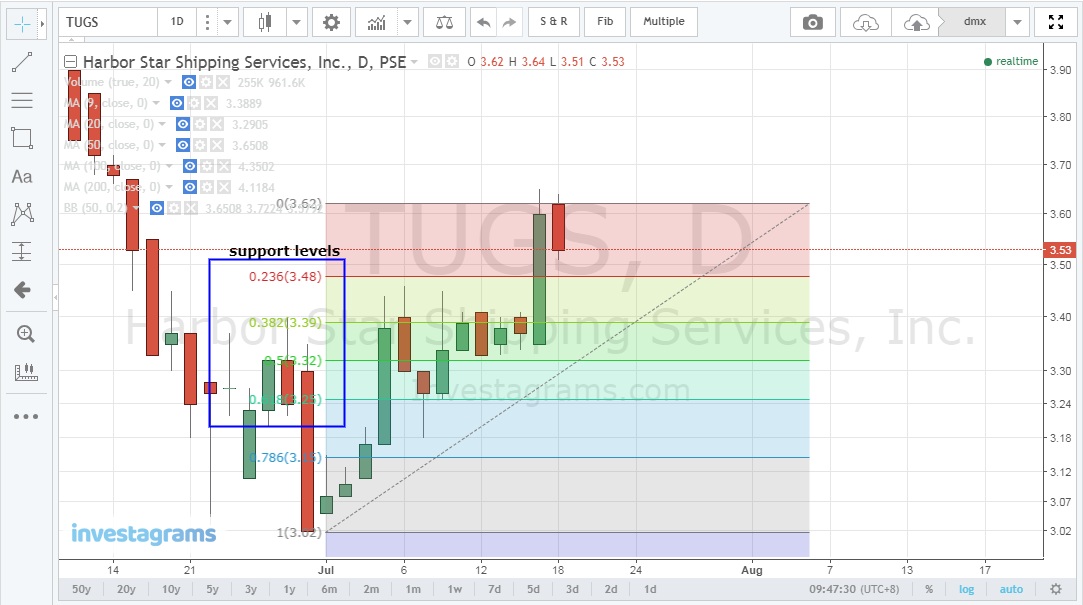 |
| charts_from_investgrams_tugs_possible_support_levels |
Our previous Resistance (3.72) already hit let's see if it manage to hold from this level as we try to set new levels of resistance ahead.
SAMPLE EXERCISES:
STOCK: IRC
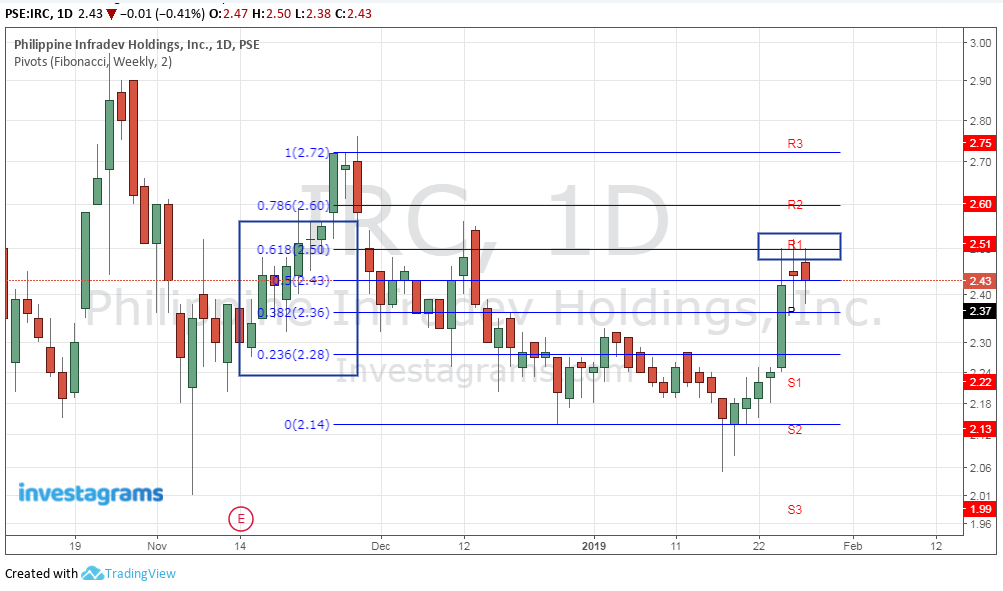
Here's a sample chart for IRC (January 28, 2019) applying fib and you can spot those resistance where price fail to break.
 |
| chart_from_investgrams_new_set_of_resistance |
STOCK: IRC
Here's a sample chart for IRC (January 28, 2019) applying fib and you can spot those resistance where price fail to break.
 |
| chart_from_investgrams_IRC |
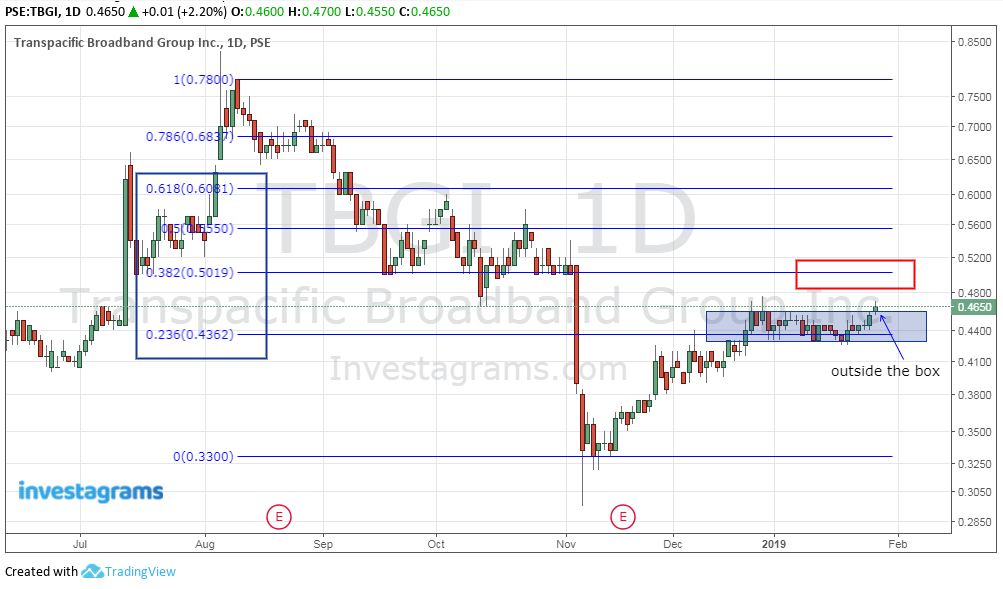
STOCK: TBGI
Looking back at TBGI (January 28, 2019) let's see if the bulls are strong enough to push this one after going out from the box.
Looking back at TBGI (January 28, 2019) let's see if the bulls are strong enough to push this one after going out from the box.
 |
| chart_from_investagrams_TBGI |
Play around with daily time frame and try to confirm from weekly to get a bigger picture on how prices are moving to catch a longer trend and bigger profits.
note: I only consider the body of the candlesticks and not on the wicks when plotting my fib but it's just a matter of preference, you may use wick to wick if you are comfortable with that.
Check out also this short video tutorial on how you will play with your charts and customized to your own liking (here).
If you find this helpful, say thanks by sharing this site to others!




2 Comments
Hello po.
ReplyDeletehello
Delete