We've run into some of the indicators already and by now you should already get the idea why you need a chart to see what would be the current market trend so you can plan your trades.
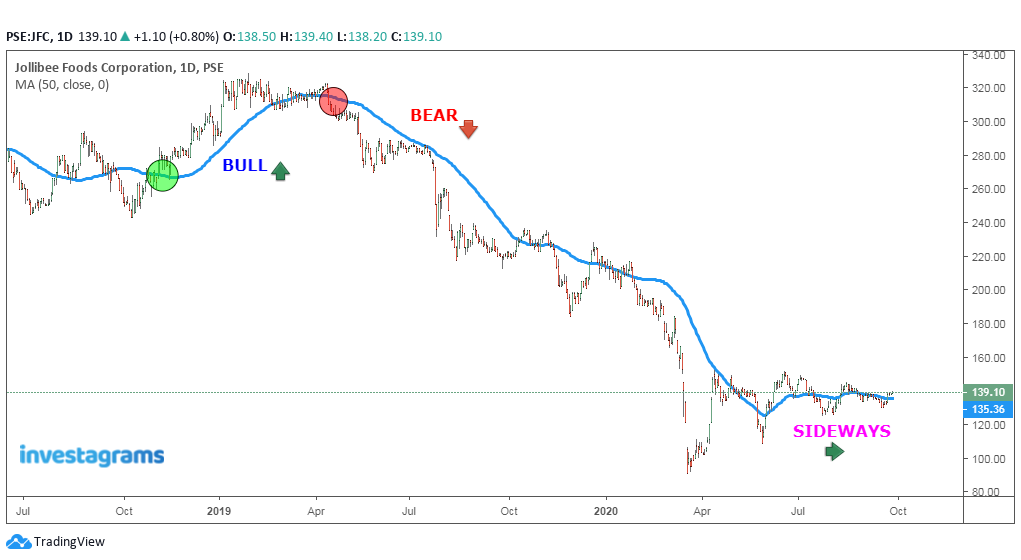
Three things that will happen in the market, price goes UP (Bull), and what goes up must go DOWN (Bear) but the market also goes SIDEWAYS (consolidation) before making its major move.
Looking at price actions alone for some would be enough but for those who lack some sort of "visualization" to mentally picture out the market's trend will need the help of some indicator such as the moving average.
Here's a sample picture with the aid of a 50-day moving average applied on price actions which clearly identifies where it rallied up and made a deep dive before it settles and waiting for its next move.
 |
| chart_from_investagrams_market_trend_with_MA50 |
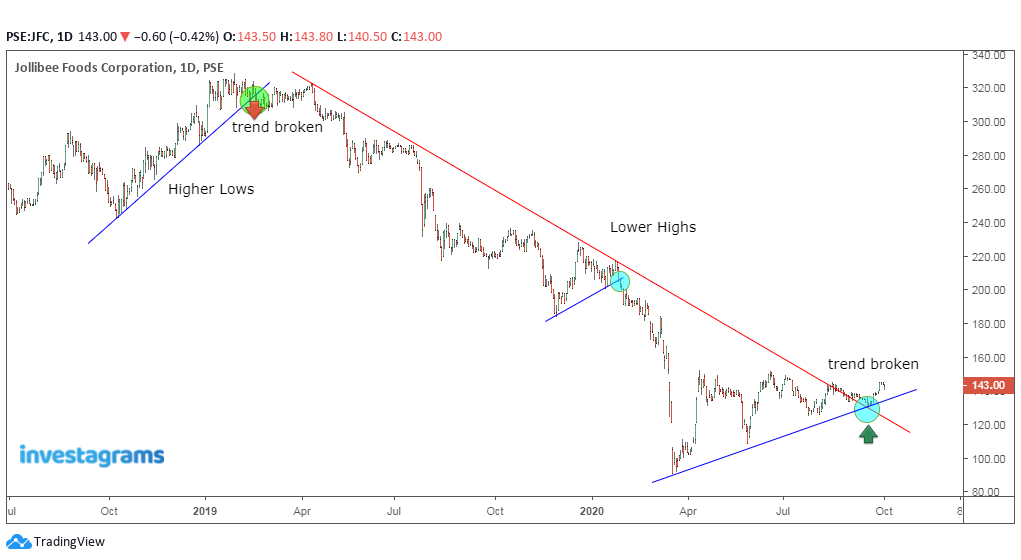
Aside from moving averages there are other ways you can use to check for the market's trend. Old school would be drawing some trend lines and draw lines to connect two higher lows or lower highs but there is a condition that at least 3 points must be connected to make it a valid trend line.
 |
| chart_from_investagrams_market_trend_with_trend_lines |
I wrote up one article of a trading system used with the help of a bollinger bands with some modification on its default values that almost replicate a moving average (read).
If you are just starting up with the markets or other trading ventures like forex and cryptocurrencies, then knowing the trend of the market would still be an advantage.
You may have heard already the old adage "The trend is your friend" and this is one of the basics you need to learn when trading the markets.
Trading needs careful planning before you execute your trades until such time you've develop your skills and be able to adapt to any market conditions that may arise and still be on top of your game.


0 Comments