From golden ratio of the nautilus shell comes the sequence of numbers called the Fibonacci. Check from this post for added details.
Like with other indicators, use this to get an edge from the market where it may give you probable levels to pick up entry points or probable take profit areas where resistance may occur.
Disclaimer: Sample charts provided are for educational purposes only.
STOCK: DITO
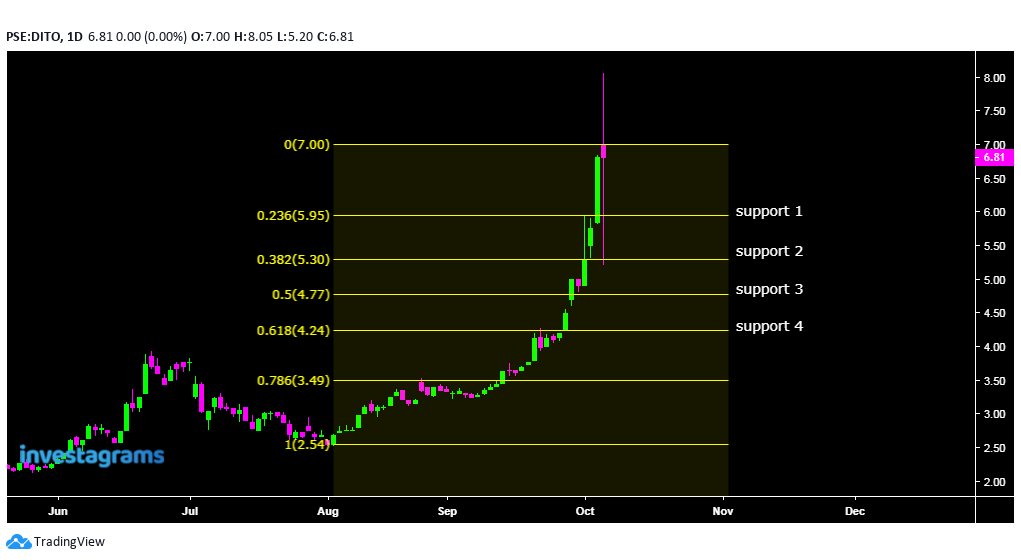
➤if it holds above 0.236 level then most likely we expect more rallies but if it breaks then move your next target on 0.382 if it manage to hold the line.
➤so far it did touched the 0.236 but made a strong bounce with that long wick and closed above that level.
➤looking also at the smaller fibo for possible supports.
 |
| chart_from_investagrams |
 |
| chart_from_investagrams |
Possible resistances
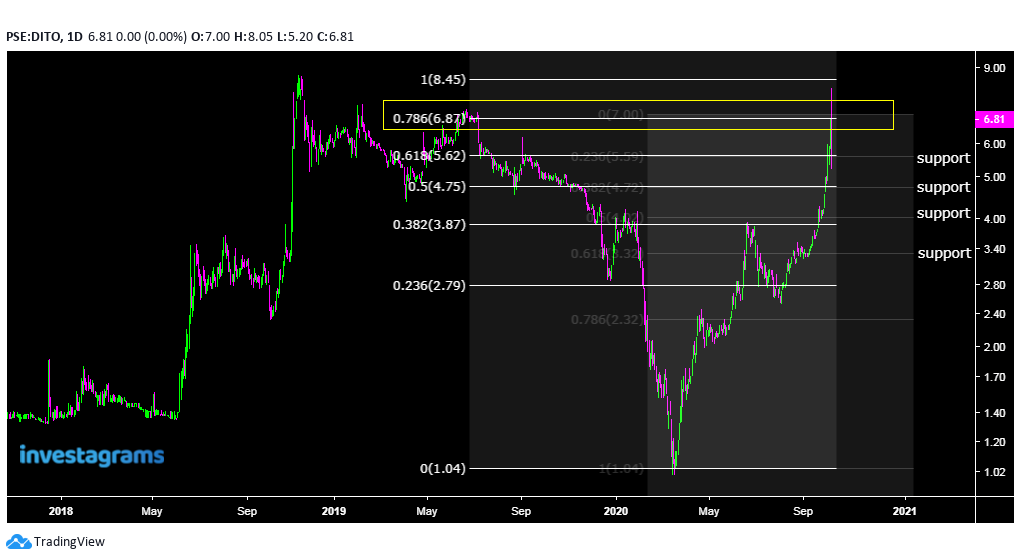
➤taking the bigger fibo as reference.
➤still tough to beat 0.786 (6.87) and need to close above this level before it attempts its previous at 8.45
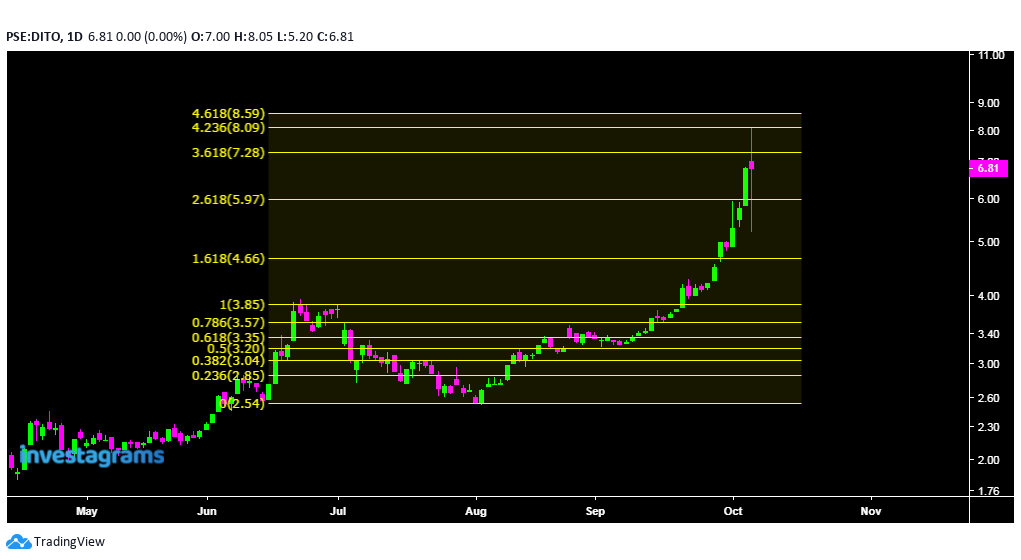
➤while looking at the smaller fibo below need to take out 3.618 before it tries the two upper resistances.
 |
| chart_from_investagrams |
 |
| chart_from_investagrams |
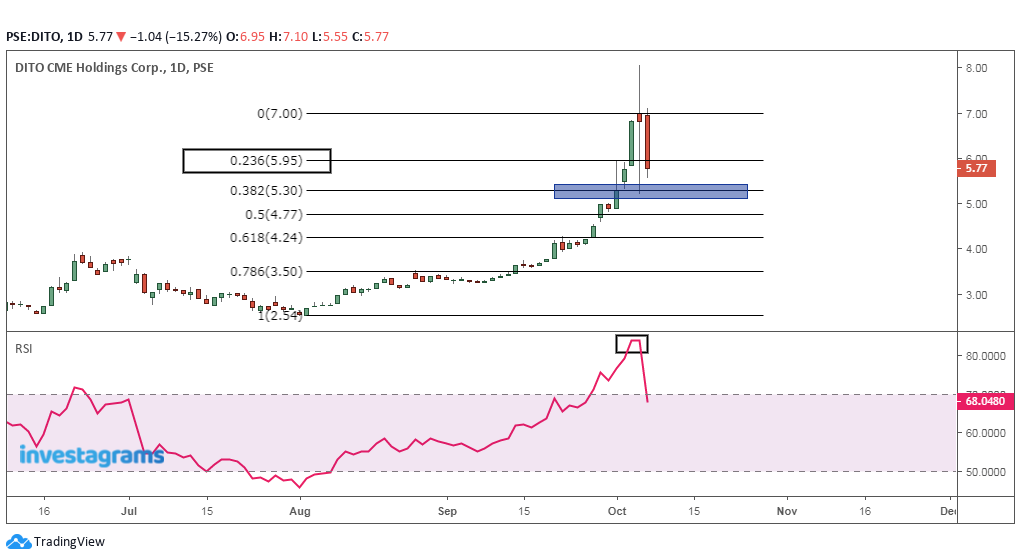
In conjunction with Señor Spyfrat parabolic theories RSI, still a good reference to avoid buying at toppish levels and wait for corrections.
Will 0.382 be able to hold and serve as strong support? Let's watch the coming weeks.
Final notes:
Make adjustments on each levels do not be too specific but widen your range, like if it falls on 4.72 then adjust to 4.50-4.72 price range as your watch levels.
So hope that would give you the idea on how you try to check for possible S&R using the fibonacci and remember that other traders may also use the same tool so the challenge would be on how you would differ on your approach.


0 Comments