Either you will be an investor or a trader in the market you need to understand on how to use charts and be able to understand what those price movements are trying to convey.
Disclaimer: There is no holy grail when it comes to the use of indicators but use the chart as your guide like a map where you get proper directions where the market is going and pinpoint probable support and resistance levels, that way you know where to set your entry and exit points.
WHAT YOU NEED TO KNOW
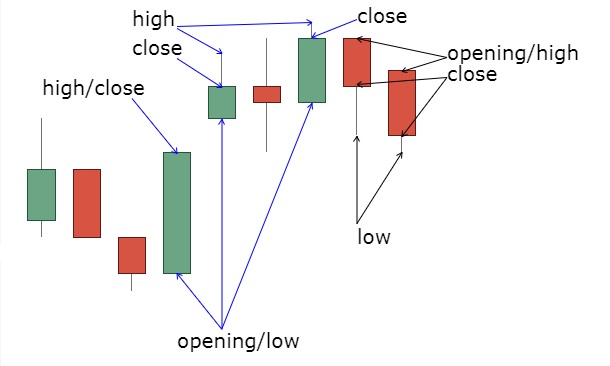
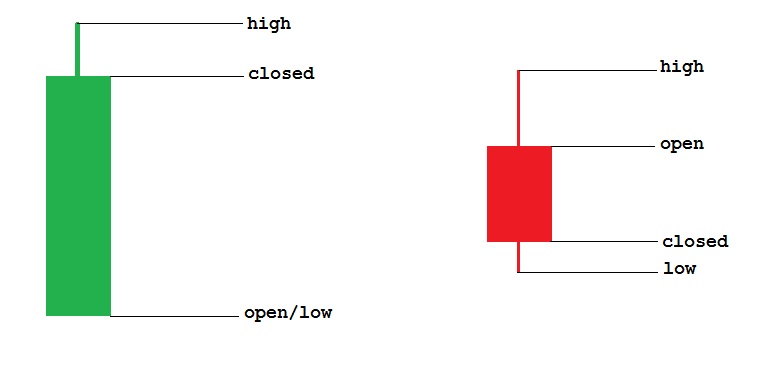
What you see on your default chart either in candle or bar form simply shows you the opening, high, low and closing for each trading day.
 |
| open, high, low, close_candlesticks |
If you see a green candle/bar then that tells you that "buyers" prevail over the "sellers" and if red would mean "sellers" overwhelm the "buyers".
Understanding the candles is simple
How candles are formed:
➤green candle is formed if the closing price is higher than its opening price.
➤red candle is formed when the closing price is lower than its opening price.
That thin line located above or below the candles is called shadows/wick and sometimes they call it as tails, so what it means if there is a long shadow above tells that there is selling pressure pushing the price downwards and if a long shadow below means some buying pressure trying to push the price up.
Between those shadows are the candle's body which also tells another story if it is long or short which is quite obvious on what color it may end up.
HERE'S HOW TO SET UP YOUR CHART
Some brokers have their own built in Charting tools so you may want to use it for your needs or use free sites provided by Investagrams.
 |
| chart_from_investagrams |
Let's breakdown some parts of the chart by numbers
1. This is where you input your stock code or symbol (JFC, MPI, ACEN etc)
2. Time frame default is in D (1 day), you can change it into lower time frames like 5min., 30min., depending on your trading strategy.
3. Price representation in the form of a "candlestick" or "bar", your own choice.
4. Indicators where you will find your "MACD", RSI, bollinger, moving averages and more to be added on your chart.
5. Saving up your work so not to set up every time you open your chart, you can make a copy and edit or make as many as you want.
6. Settings where you can change the color for your candlesticks or bar, background, watermarks, grid etc.
7. When you want to share your chart you may use the camera to take a snapshot of your own study.
Indicator Settings
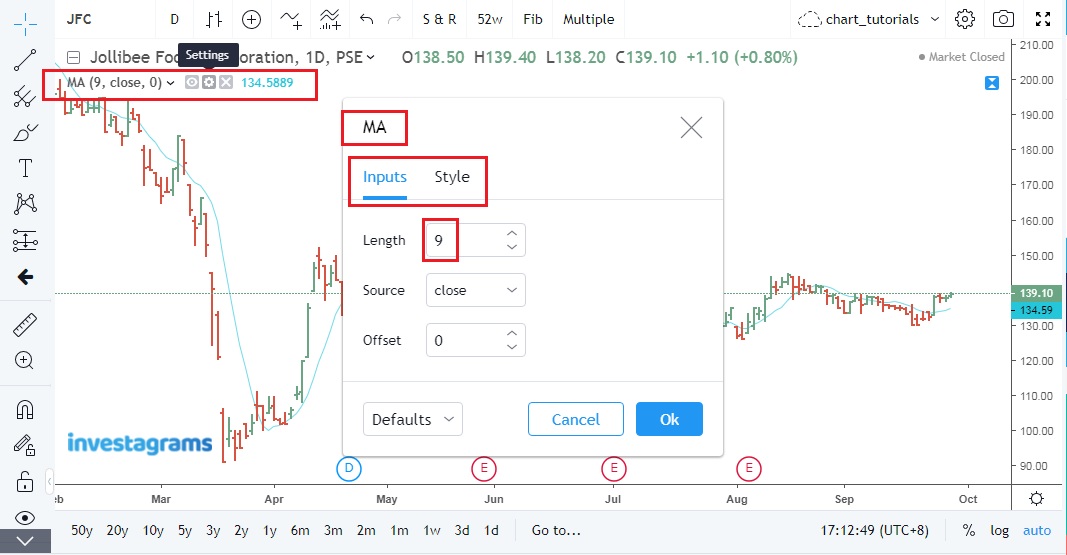
You can also modify the input and style of each indicator you have added into your chart by clicking on the settings.
Play around with colors, line thickness, and values depending on your own preference that would suit your trading needs.
Example of Moving Average (MA) with the default value of 9, as you can modify and set later to your desired lengths like 50, 100, 200 etc as needed.
 |
| chart_from_investagrams |
Short Video Tutorial on setting up
➤this applies to other indicators you will be adding to your chart, the process is the same and you can explore on the left side tool for other drawing tools.
➤set quality to 720 and speed 1.25
➤set quality to 720 and speed 1.25
Check out also this other video tutorial on how you will play with your charts and customized to your own liking.
Go now and start to explore and experiment on the different indicators/oscillators available and add them up to your chart.


0 Comments