 When I was starting in stocks it was all pure luck if I may say if you have read my short story how I get started (here). Through the years since 2016 I have started to make use of simple tools like MACD, looking at price actions where possible support and resistance as well as other indicators and tips from Spyfrat, Shoyu Ramen to name a few.
With all those consolidated tools from other traders, I also came across with the blogs of Guillen Rocher, Omeng Tawid, Abner Meneses, Stocksentinel, ZeeFreaks and others whom I forgot to mention.
Anyway, let me just share to you the AOTS (alignment of the stars) that I read from ZeeFreaks which is quite simple to use and I know everyone can easily apply on their trading for stock selection etc.
Though you can still use the bollinger bands by Spyfrat for confirmations or rely on the MA50 which I discussed from this post or may visit here to check the market trend.
If you haven't started setting up your charts read tutorial here.

Though you can still use the bollinger bands by Spyfrat for confirmations or rely on the MA50 which I discussed from this post or may visit here to check the market trend.
If you haven't started setting up your charts read tutorial here.

Just be reminded that I just added the MA200 which I read from Minervini (who scout stock using MA30,MA40,MA150 and MA200) and also added up the 5min time frame for my proper entry/exit since I noticed that there is also AOTS formation on lower time frames.
HOW TO USE AOTS:
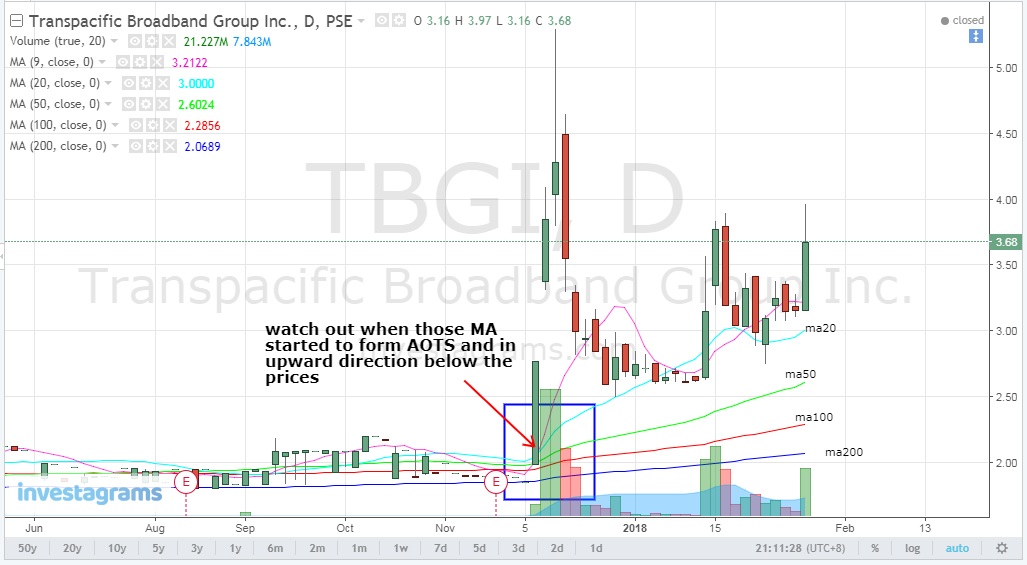
Getting started all we need is the moving averages (MA) of 20, 50, 100, 200 and in a Daily time frame. I only added the MA9 or MA10 as my trail stop for 5min time frame. Here's a sample chart of AOTS formation.
Disclaimer: Sample charts provided are for educational purposes only.
STOCK: TBGI
Sample demo only when TBGI has not yet gone through stock split (change of par) you may read further details of stocks on stock split here.
 |
| AOTS_daily_time_frame |
Save your settings on MA from your chart and start to scout for stocks who are about to form AOTS in daily time frame.
 |
| chart_from_investagrams_watch_for_AOTS_formation |
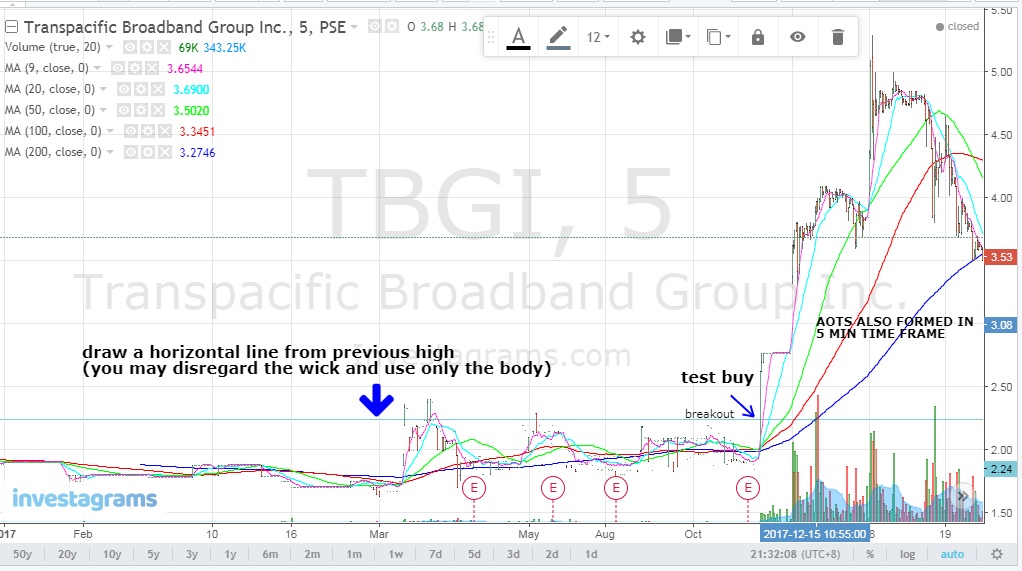
When a sign of AOTS is about to form, look for previous high and draw horizontal line, if the price breaks out from that line you can do some "test buy" if you think there is no strong volume present that it might be a bull trap as they say.
 |
| chart_from_investagrams_watch_for_breakouts |
Start buying in tranches worth ₱8k+ to make sure you maximize the fees.
To confirm for your entry open in 5min time frame and you will also learn if AOTS is also formed, if no AOTS in 5min time frame do not set any buy orders yet until you can spot one.
To confirm for your entry open in 5min time frame and you will also learn if AOTS is also formed, if no AOTS in 5min time frame do not set any buy orders yet until you can spot one.
Explore with other time frames if not comfortable with the 5min tf.
 |
| chart_from_investagrams_5min_time_frame_for_entry_and_exit |
The trail stop (sell) either use MA9 or MA10 once the price starts to go below this level, you may start selling either half of your position if you believe that the momentum is still strong in Daily time frame if not sell all position and wait for another possible AOTS formation in 5min time frame for possible re-entry.
 |
| chart_from_investagrams_trail_stop_MA9_or_MA10_at_5min_time_frame |
Using trail stop at a lower time frame like 5min chart would be useful to protect your profits even when the AOTS in Daily is still holding.
 |
| chart-from_investagrams_Daily_time_frame_MA50_MA100_MA200_still_holding |
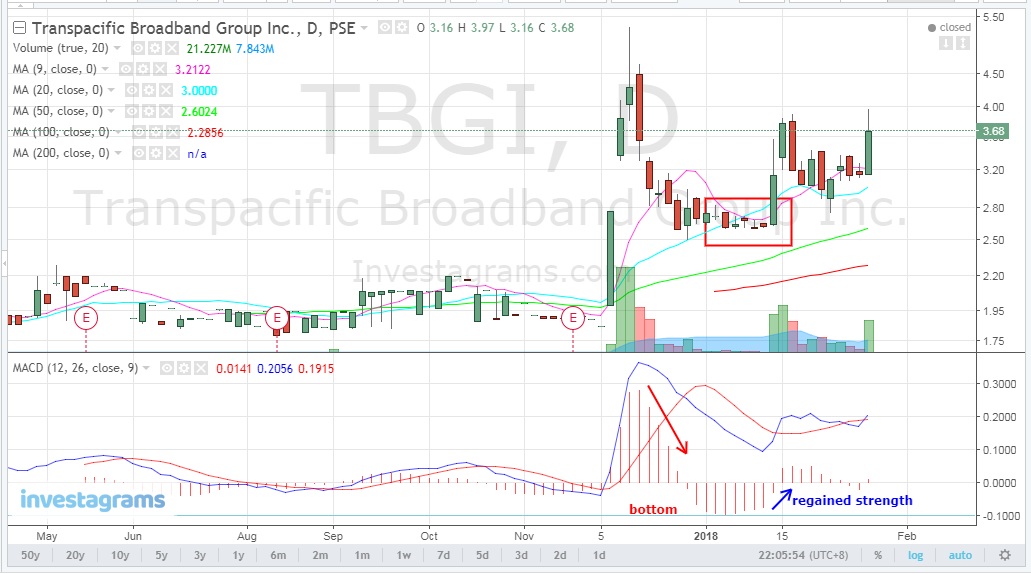
In case there will be some pullbacks with momentum you may add MACD histogram and check for some bottom areas where you can pick your entries.
 |
| chart_from_investagrams_MACD_histogram_bottom_picking_inspite_hitting_MA20 |
You may use the daily or 5min time frame when below the 0 level and starts to move upwards means the momentum is regaining strength (buyers come in) -credits to Shoyu Ramen.
Now to get some insights on possible bounce and strong base use Fibonacci to check for levels like 0.236 that after a break out to test if the uptrend is strong price must stay above that level (credits to Stocksentinel), if in case it go below this level check for 0.382 and 0.618 for retracement while if it stays at 0.50 will be the playground for "tsupiteros" as mentioned by Traders Empire (credits to Guillen Rocher).
How to use Fibonacci retracement (here) to be able to spot possible support and resistance for possible bounce or reversals.
 |
| chart_from_investagrams_Fibonnaci_possible_retracement_levels |
If you happen to miss out selling at the top and know that it only had a healthy pullback then you can add on dips to add more shares as long as more bullish not on a diving market.
*Average down is not a practice for traders but as long you have the base, meaning you were able to pick just before the break out then adding some shares from healthy pull backs would still be fine. More volume gives you bigger profits, applying this on a bear market is a disaster unless you make some cuts and buyback.*
So the main point of AOTS is for us to anticipate any breakouts and we try to follow that trend or momentum until there is a sign of reversal (SOR) using our trail stop in lower time frames.
"though, well experienced traders say do not anticipate a break out but I'm trying a different path I do anticipate break outs as long as I spot AOTS formation with my own trail stop and please do not buy at the top-buy when a previous price is broken with Volume or if price is already near a previous high you can position earlier as long as you have your stop loss points if it fails."
Failure to ride break outs just wait for the pause days, if no drastic sell offs the following days be patient to wait for possible entry.
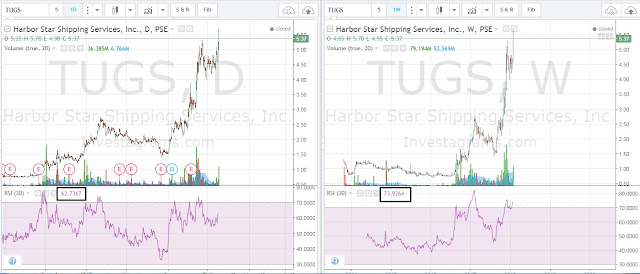
Add up RSI 30 as mentioned by Spyfrat on parabolic curve theories to check the strength of its momentum for stocks on break outs.
 |
| Spyfrat_parabolic_curve_theories |
A back testing done by Pethuel Pomaloy which is also a good read (here) applying the parabolic theories.
Depending on your determination to study and learn other indicators that will equip you from your trades then that would be your own prerogative.
You already heard about the BOBO play (Buy on Break outs) but again make sure to have your own risk management to stay in the game which you can read from here. Please don't be a FOMO trader, you have been warned. (Fear of Missing out)
Disclaimer: Sample charts provided are for educational purposes only.
Let's make some case study of the following:
STOCK: ATN (ATN Holdings, Inc.)
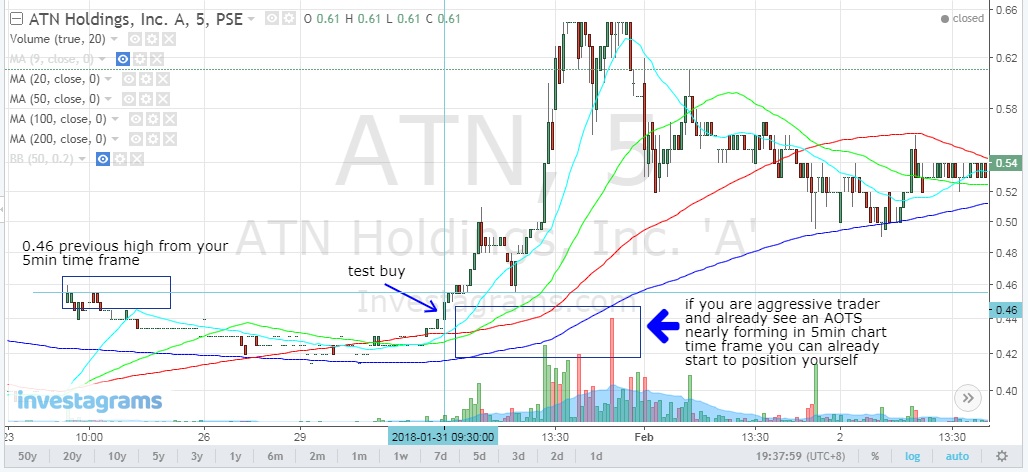
On January 31, 2018 AOTS is about to form as moving averages positioned in an upward direction and based from previous high along 0.46 it broke that level with volume present.
 |
| chart_from_investagrams_ATN_aots_Jan_31_2018 |
Checking from the 5 min time frame of ATN (January 31, 2018) AOTS is also about to form where you can decide to "test buy" in tranches or whatever amount you wish to invest.
 |
| chart_from_investgarams_ATN_5min_charts |
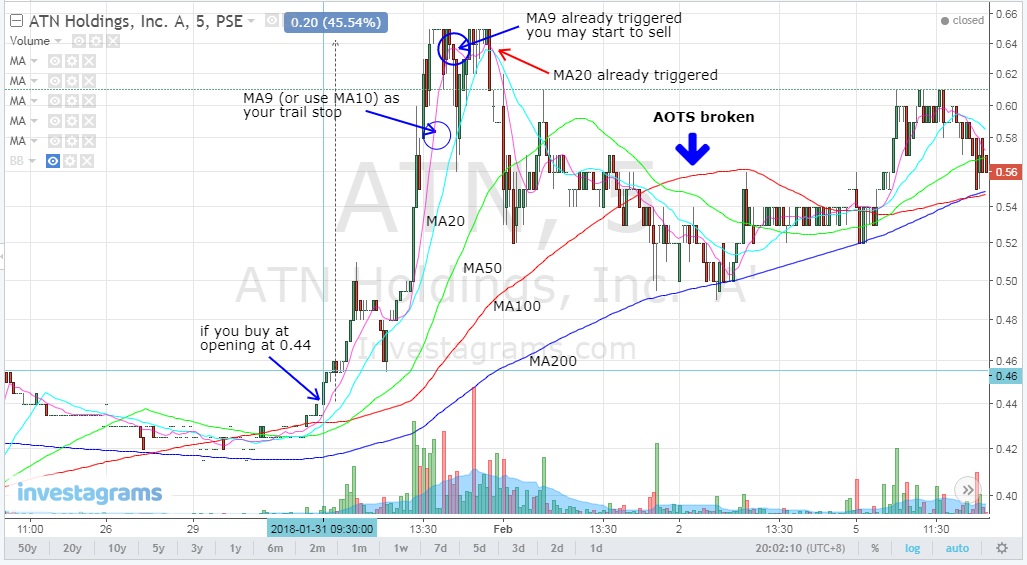
Setting your MA9 or MA10 trail stop to exit your position if triggered before your AOTS is violated. If you were able to enter at opening price of 0.44 and able to take profits (0.64) when your trail stop is triggered before MA20 triggered would at least give you 45.54% gains.
 |
| chart_from_investagrams_Trail_stops_to_protect_gains |
AOTS still intact on it's second day though there was selling pressure that took place, use Fibonacci to establish your base support and if it close above that level then the momentum is still strong.
 |
| chart_from_investagrams_finding_strong_support |
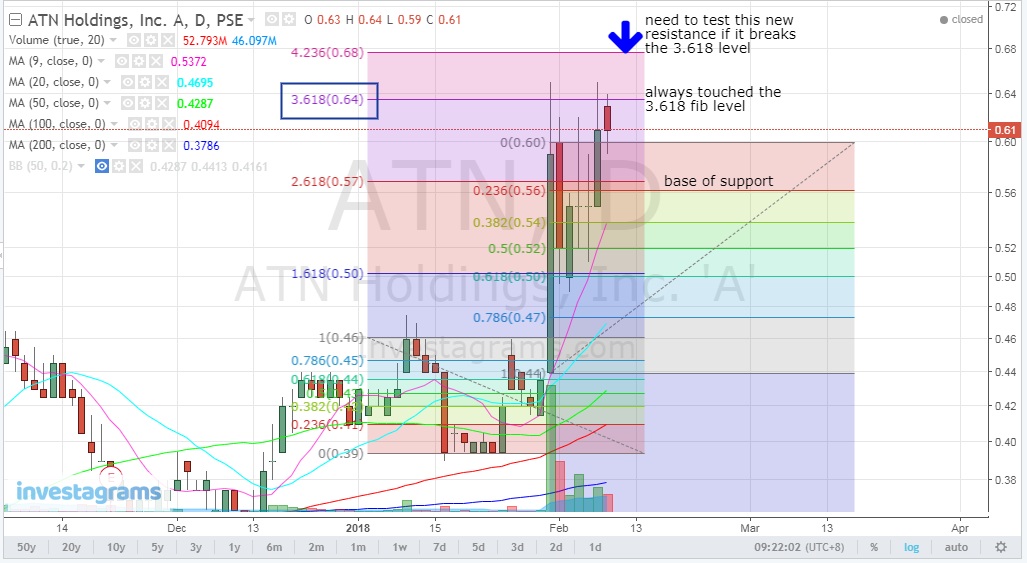
On 2nd day however it managed to stay along 0.50 fib level, as for the 3rd day it close above 0.382 fib level same with 4th and 5th day after the break out.
6th day it already closed above the 0.236 fib level as your base support which is a good sign that the momentum is gaining strength while still on AOTS, if you are still holding your position at 0.44 and failed to sell when your MA9 or MA10 trail stop triggered in 5 min chart time frame then you may also want to hold and monitor the AOTS daily until it is broken.
6th day it already closed above the 0.236 fib level as your base support which is a good sign that the momentum is gaining strength while still on AOTS, if you are still holding your position at 0.44 and failed to sell when your MA9 or MA10 trail stop triggered in 5 min chart time frame then you may also want to hold and monitor the AOTS daily until it is broken.
 |
| chart_from_investagrams_ATN_resistance_levels_via_fibonacci |
7th day (image above) touched again the 3.618 fib level best if it could close above this level and will test the new resistance level at 4.236 (0.68).
STOCK: ION (Ionics Inc.)
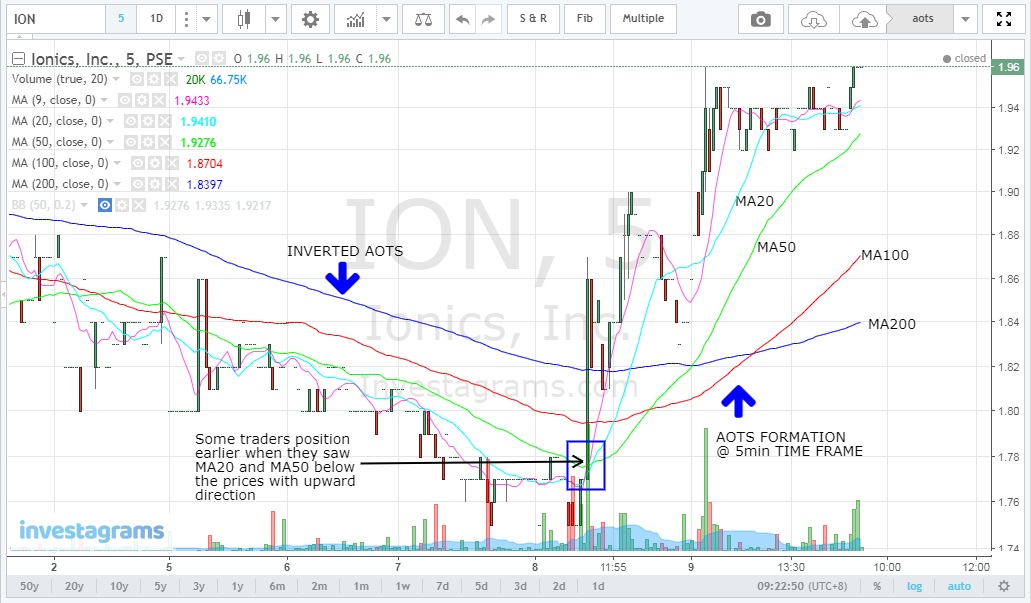
Sometimes early AOTS formation is also seen from 5min chart time frame ahead from the daily time frame (after a short lived AOTS), where you can also take advantage if both MA20 and MA50 are starting to position below the prices as shown.
STOCK: ION (Ionics Inc.)
Sometimes early AOTS formation is also seen from 5min chart time frame ahead from the daily time frame (after a short lived AOTS), where you can also take advantage if both MA20 and MA50 are starting to position below the prices as shown.
 |
| chart_from_investagrams_ION_5_min_time_frame |
Using simple trend line to monitor any break out from that line can also give you some advantage while waiting for AOTS in daily which must be at least supported with volumes to support the break out.
 |
| ION_daily_time_frame |
STOCK: SSP (SFA Semicon)
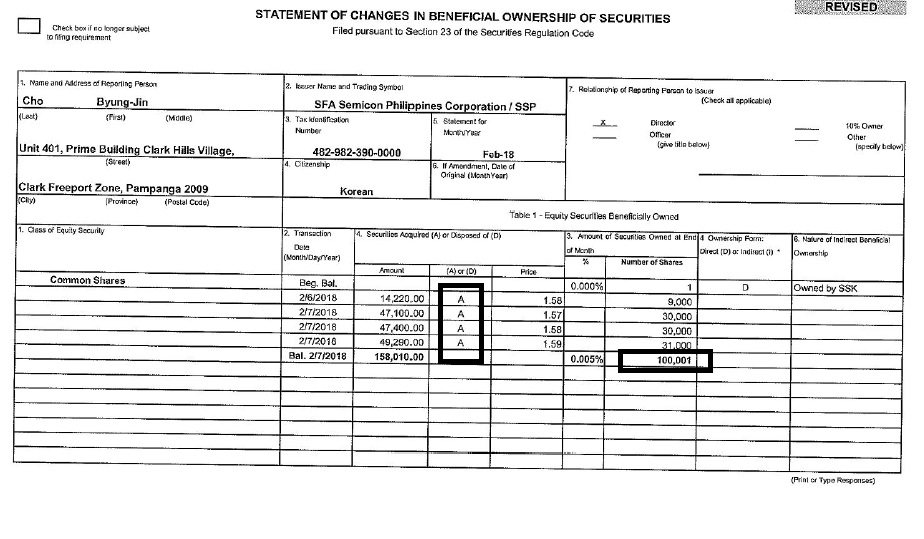
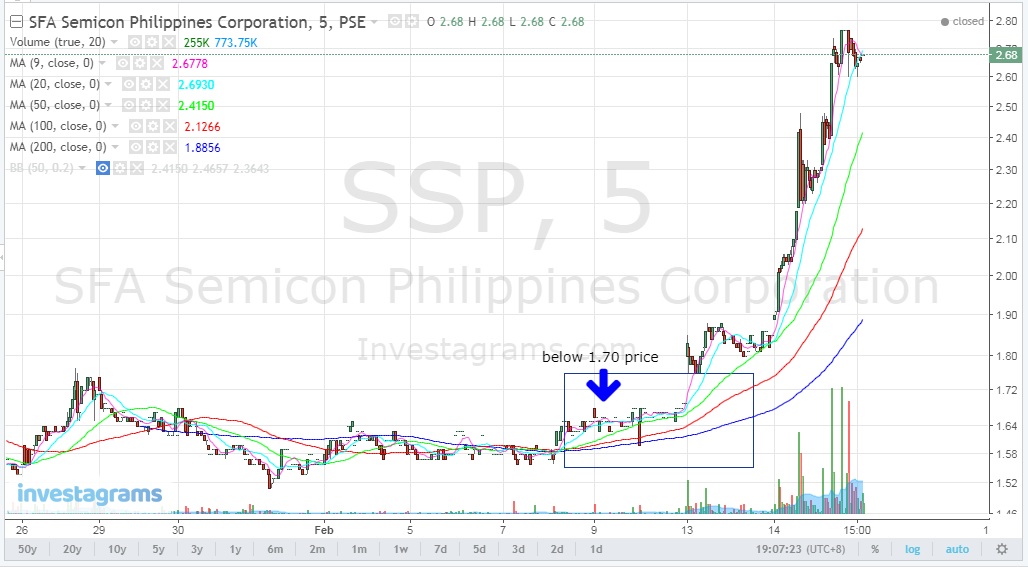
Another classic sample of an early AOTS formed from the 5 min chart time frame below ₱1.70 price level as disclosure from PSE dated Feb. 8, 2018 as one of their Director starting to accumulate some shares below ₱1.60 price which of course will trigger some insiders to accumulate shares as well as they can see this as good news.
Another classic sample of an early AOTS formed from the 5 min chart time frame below ₱1.70 price level as disclosure from PSE dated Feb. 8, 2018 as one of their Director starting to accumulate some shares below ₱1.60 price which of course will trigger some insiders to accumulate shares as well as they can see this as good news.
 |
| SSP_disclosure_Feb.8,2018 |
 |
| chart_from_investagrams_SSP_5min_time_frame_AOTS_formation |
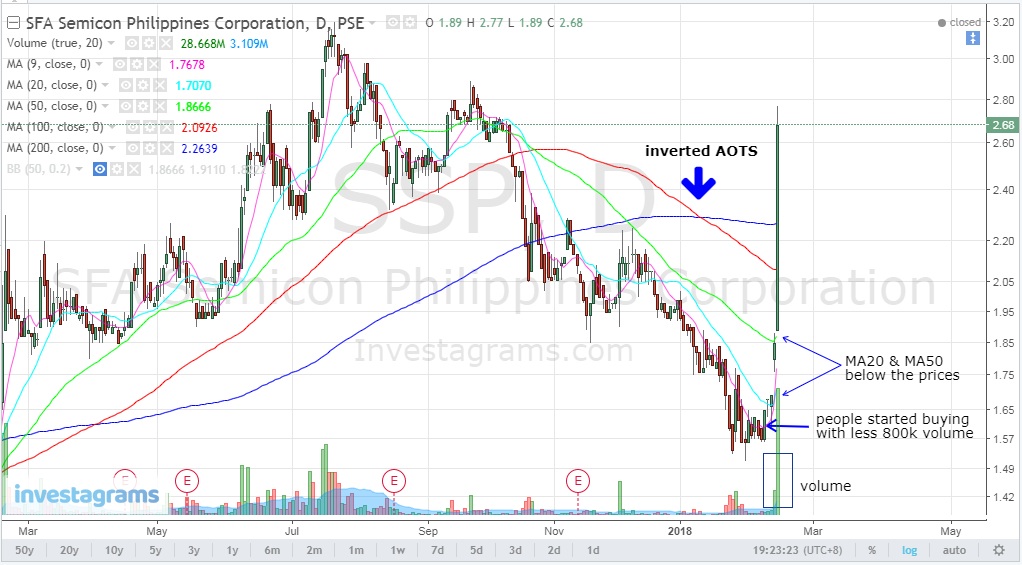
Whereas if you look at the daily time frame still on an inverted AOTS but somehow MA20 & MA50 started to position below the prices accompanied by volume after the disclosure of Director accumulating shares, not sure with news if it has driven the market (read here)
 |
| chart_from_investagrams_SSP_daily_time_frame |
Since no AOTS yet in daily its still hard to tell how high will they push the price higher given there's a huge volume for the last two days and hitting its ceiling price at ₱2.77 which we can expect for some gap up depending on the demand by the market if not then expect some will take profit just in case since no trading on Feb. 16, 2018 to give way for Chinese new year.
Plays like this you must also be ready if price weakens due to profit taking or if they will push it higher since it is already near its 52 week high at ₱3.20 and watch for continuation on Monday as it can be compared to a 52 week high Friday rule (read here).
Again it's up to you on how you will make use of AOTS to your advantage if you see some opportunities to make some quick profits until a solid AOTS formation is formed in daily time frame to be able to ride a trend longer and gain more.
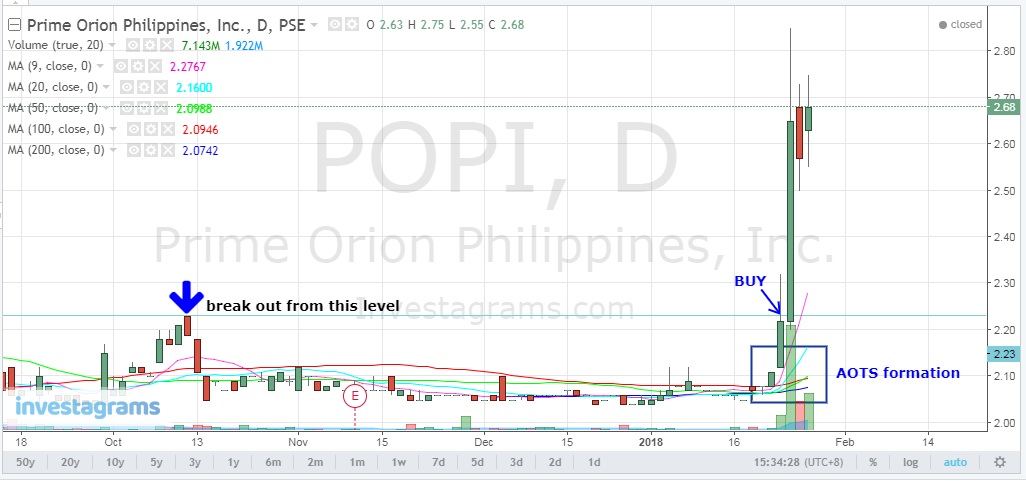
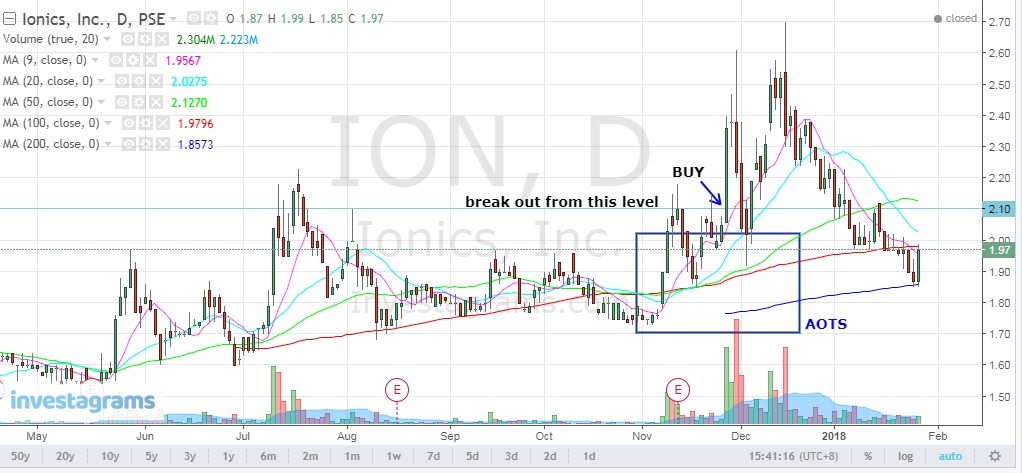
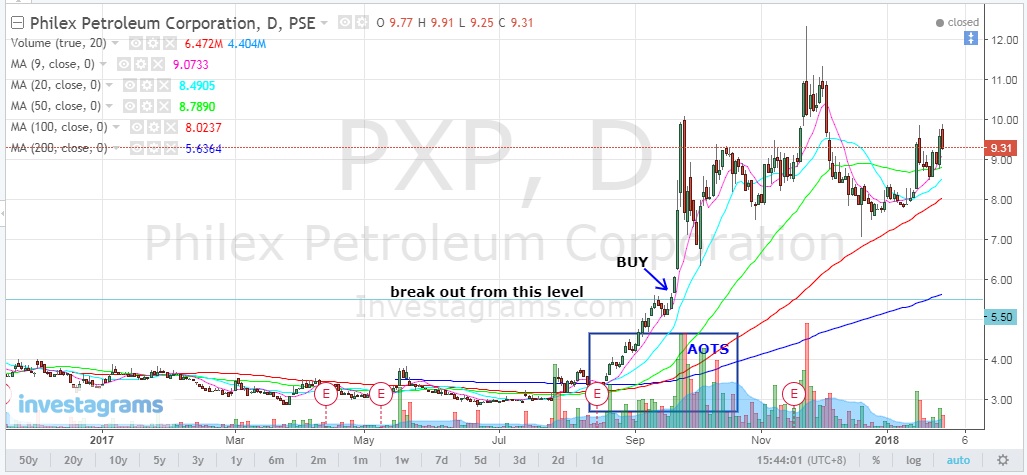
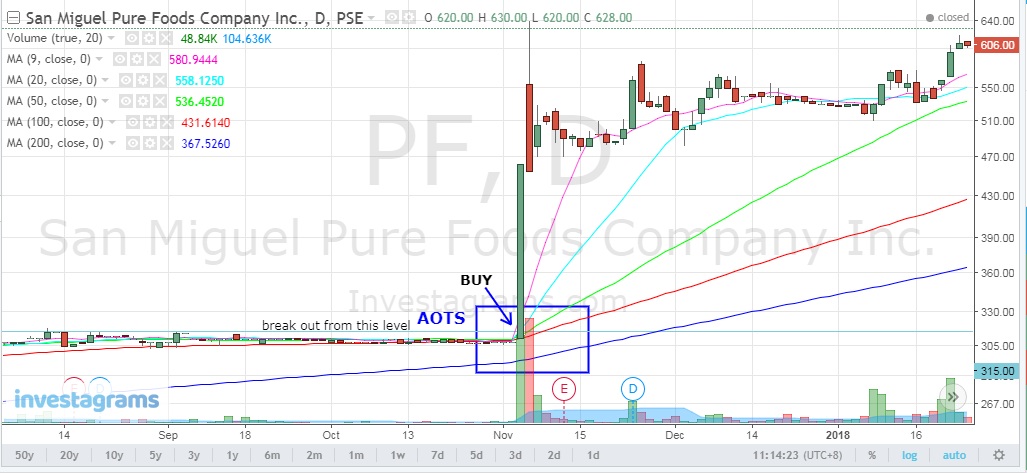
Here are sample of AOTS with break outs for your study.
 |
| POPI_break_out |
 |
| IDC_break_out |
 |
| ION_break_out |
 |
| PXP_break_out |
 |
| PF_break_out |
With AOTS you can ride the trend until it bends as shown from sample stocks above, if you are able to ride these trends then you can simply enjoy the profits compared to day traders always in and out from the market with small profits unless they have bigger funds to play with.
STOCK: TUGS (Harbor Star Shipping Services, Inc.)
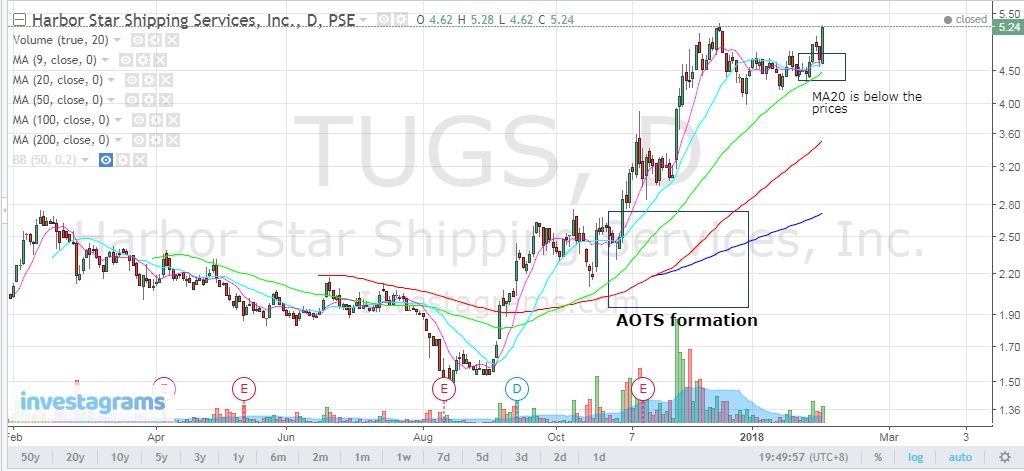
Let me give you a sample for TUGS break out even it has already formed an AOTS and went through some consolidation and gives you another opportunity.
STOCK: TUGS (Harbor Star Shipping Services, Inc.)
Let me give you a sample for TUGS break out even it has already formed an AOTS and went through some consolidation and gives you another opportunity.
 |
| AOTS_break_out_DAILY |
Image above showed the AOTS formation (Daily Time Frame) around November 2017 and made some retracement before the consolidation and MA20 started to position below the prices with MA50,MA100,MA200 still on AOTS.
 |
| chart_from_investagrams_TUGS_5_min_chart |
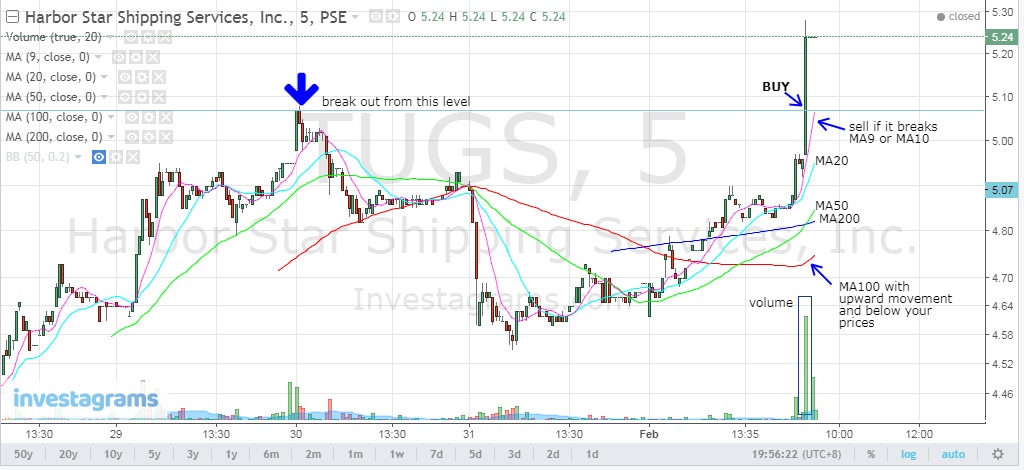
Looking at the 5 min chart seems the AOTS formation is not yet perfect but the MA100 already starts to show some signs of upward movement and with some previous high already exceeded with volume along 5.07 area so you could already position yourself along 5.08 to 5.10 with MA9 below the prices.
TUGS above after consolidation started to show some AOTS formation in 5 min chart with breakout at 5.07 level but in Daily time frame it has not yet completed the break out from 5.24 level as it has to close above this area to consider this as a valid breakout.
TUGS above after consolidation started to show some AOTS formation in 5 min chart with breakout at 5.07 level but in Daily time frame it has not yet completed the break out from 5.24 level as it has to close above this area to consider this as a valid breakout.
 |
| chart_from_investagrams_TUGS_daily |
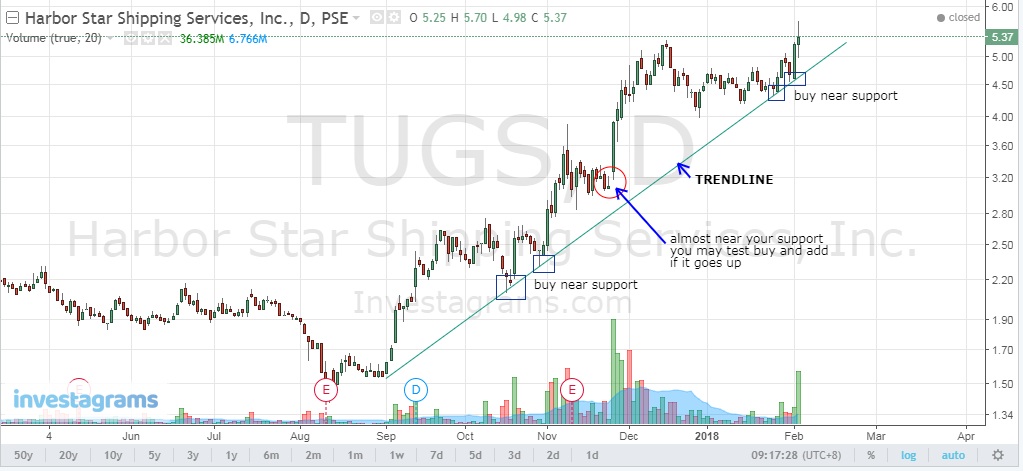
If you happen to have a hard time finding the best entry even with AOTS you may go back to the old school style of finding the nearest support by using trend lines check it out from Lloyd Bazar (here).
 |
| Trend_lines_buy_at_support |
Always buy near support and sell at resistance when using trend lines or going back to your 5min chart time frame with your MA9 or MA10 as your trail stop.
STOCK: JFC (Jollibee Foods Corporation)
Lastly an overview of AOTS where you can simply get the idea where you should buy or make positions and where you will sell to lock in profits or simply protect your gains and re-enter for another AOTS formation, sample image below already speaks for itself on how you can make use of AOTS. Click image to view its full size.
 |
| JFC_AOTS_formations |
All credits and kudos to mentioned traders above who became my mentors online by studying their own styles through their blog posts etc, where I based my own study and incorporated in my trading system, it's up to you how you will digest and try to apply also in your trades and you are not limited to the 5min time frame you may experiment with other lower time frames like 3min, 15min, 30min etc.
For newbies like me AOTS is already a good start compared from my previous posts on using MACD on buy signal, the ema13 crossover ma20 etc, just make sure the MA200 is below your prices in Daily time frame using AOTS.
You may also want to visit and download excel stock market calculator here.
Food for thoughts, trying to compare with other set up (read post here), my own unbiased opinion simply both are profitable as long as you know how to use it to your advantage.
"Learning does not stop after schooling"
You may also want to visit and download excel stock market calculator here.
Food for thoughts, trying to compare with other set up (read post here), my own unbiased opinion simply both are profitable as long as you know how to use it to your advantage.
FACE to FACE
 |
| chart_from_PSEtools_Moving_averages_vs_Bollinger_bands_(chart from PSETools) |
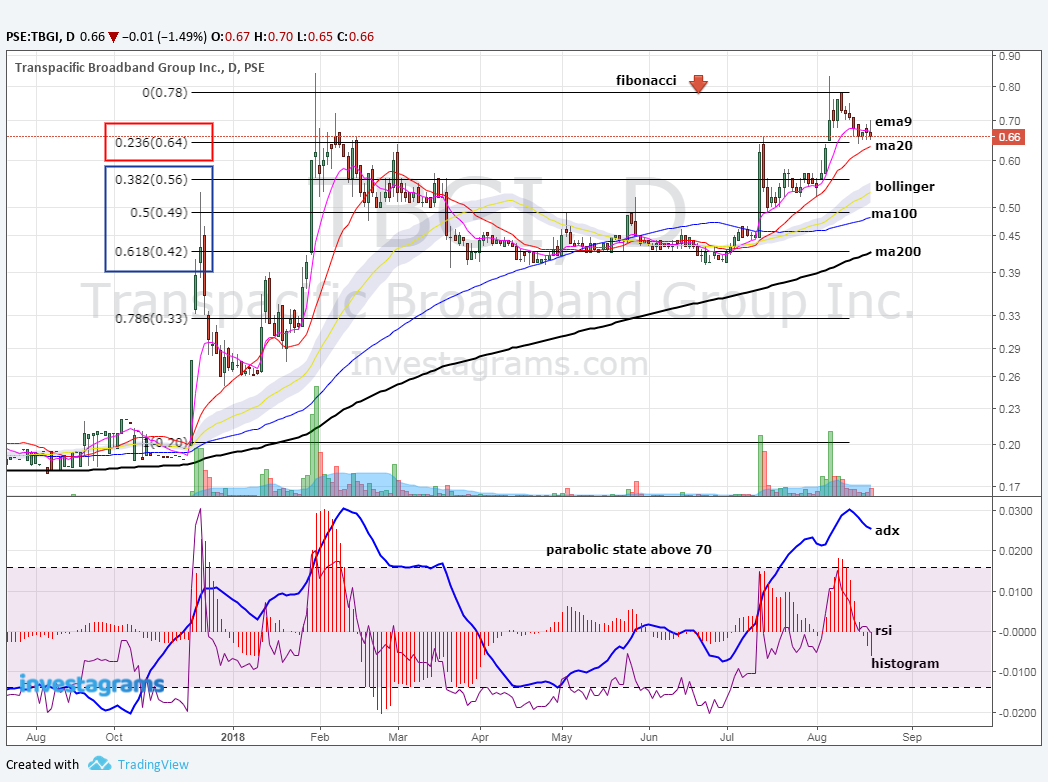
But wait what if I tell you we can combine all ideas from greatest traders in just one chart from aots, spyfrat, fibonacci, macd histogram, adx etc. and just move around from different time frames?
rationale:
ema9-use as trail stop in lower time frames instead of ma9 to protect our profits
aots-in daily and lower time frame to nail break outs before it happens
spyfrat trading sytem (sts) bollinger+rsi-daily and weekly to catch parabolic state stocks
fibonacci-daily for bounce plays (support+resistance)
adx-for momentum strength confirmation (above 30)
macd histogram-for bottom fishing from weak hands
We get a hybrid charting tool...is it too much or overkill? :)
 |
| chart_from_investgarams |
Best to add RSI(30prd) and set to 70 and 50 levels and play stocks that goes beyond the 50 level mark.
Hope you learn something, just understand the system and note whatever you think may be useful on your trades.
Hope you learn something, just understand the system and note whatever you think may be useful on your trades.
It's not only about learning how to plot those indicators on your chart for display but knowing how to use those tools to your advantage or that may give you an edge that counts and how you execute your trades with risk management is the key.
If you find this helpful, say thanks by sharing this site to others!
If you find this helpful, say thanks by sharing this site to others!


8 Comments
Can you give me a link to further explain how AOTS works? Thanks!
ReplyDeleteYou may click on ZeeFreaks name above with link on his blog and browse on AOTS
DeleteSir how about this po, MA200 is N/A. See screenscap here https://i.imgur.com/SFuBdWB.png
ReplyDeletejust try to zoom in zoom out your chart, MA200 still visible. cheers!
Deletehttps://imgur.com/a/ffq2b
Thank you so much for giving me fully understanding for this kind of set up (AOTS) for my entry trades. Godbless you and your family.
ReplyDeletehappy to help, happy trading!
Deletei am reading this now in Oct2020 and just trying out the aots strategy. Can you pls give me your experience as to how much in % is your profit in a year using this strategy? Did this strategy give you 20%, 50% ROI in your port?
ReplyDeleteThanks for reading, personally you should not focus on the % regardless of any indicator you will be using but rather use it only as your guide or reference as there are no "holy grail" when it comes to the use of indicators but only gives you a picture of what the market sentiment is.
DeleteThe moment you label each indicator with "percentages" will only trigger your emotions if it fails to meet your expectations.
Rather use these tools to your advantage the moment it shows up in your chart. If you use it right then the amount of profit will follow and you won't count years if you perfected your own system.
Just a sample trade I made of NOW dated 1-11-2018 bought at ₱2.87 and sold 1-22-2018 at a price of ₱5.20 because based from what I saw at that time was about to form.
Another sample I trade with TBGI 8-3-2018 with an entry of ₱0.58 then sold 8-8-2018 at the price of ₱0.75 cause it was about to break a previous high with an intact aots formation.
It is more on "how to use" it to your advantage and not to "how much" will these strategy gives me profit, else you are focusing on the profit and not on the process.
Learning from other trader's style will help you come up with your own in the long run
and what I shared is based from my own interpretation and understanding but you are free to experiment and back test the setup if it works for you.
You can just imagine if everyone is using "aots" then everybody decides not to buy if there are no signs of formation, and simply awaits for some big whales to jump in to make it happen? For sure you need to innovate :)
Hope that helps!