 Let's try to tackle another trading style which is well known to other traders, a style that originated from Nicolas Darvas a celebrity in the late 1950s as dancer who was a self-taught investor and author as well.
If he did it by himself then you can say to yourself "I can do this!" so whoever wishes to learn will definitely reap results in the end just like Darvas did.
I won't be going over the book in detail where some traders try to interpret how Darvas did it but will give you my own insights on his own strategy.
For those who wish to read "How I Made $2,000,000 in the Stock Market." you may simply try to google it out.
There's also a video from Youtube by MG(Money Growers) and explained it in detail if you want to watch.
So the concept behind the Darvas box is simply on stocks that will create new ATH/52 wk high with some volume, but if you are a high risk taker either in a bull or a bear market you can still apply such strategy as long as you know where you would set your own stop loss points.
Don't take it literally as a perfect box formation but more of a rectangle shape when using Darvas system.
All you need to know is the previous high and low to create your own box, it's like your resistance vs support if you won't plot those boxes/rectangle tool.
Adding the rectangle tool will help us easily visualize what is going on in the market and trying to confine or limit our range in trading which may help us lessen our risk.
Now you just need to watch out which one will comes first if it breaks out from your upper portion of the box or breaks down from your lower portion of the box, simple as that.
Set your own stop loss/cut loss points to protect your capital or adjust your trail stops to protect your profits.
Regardless of an ATH or 52 week high it doesn't matter for me as long as there would be opportunity that may arise you may start plotting your boxes, now it's up to you how you will use it to your advantage.
Regardless of an ATH or 52 week high it doesn't matter for me as long as there would be opportunity that may arise you may start plotting your boxes, now it's up to you how you will use it to your advantage.
Disclaimer: Sample charts provided are for educational purposes only.
Sample Studies:
STOCK: TBGI
First look for the highest point and lowest point , this will be our basis to create our boxes
 |
| chart_from_investagrams |
Once you determine those points you may start to draw your box using the rectangle tool from your chart.
Once it goes out from that box breaking your highest point would be your cue to test the waters by buying in tranches.
Once it goes out from that box breaking your highest point would be your cue to test the waters by buying in tranches.
 |
| chart_from_investagrams |
You may use the lowest part of your box as your stop loss/cut loss points or use previous candle's opening or closing price if the next candle will break out from your box, your choice.
 |
| chart_from_investagrams |
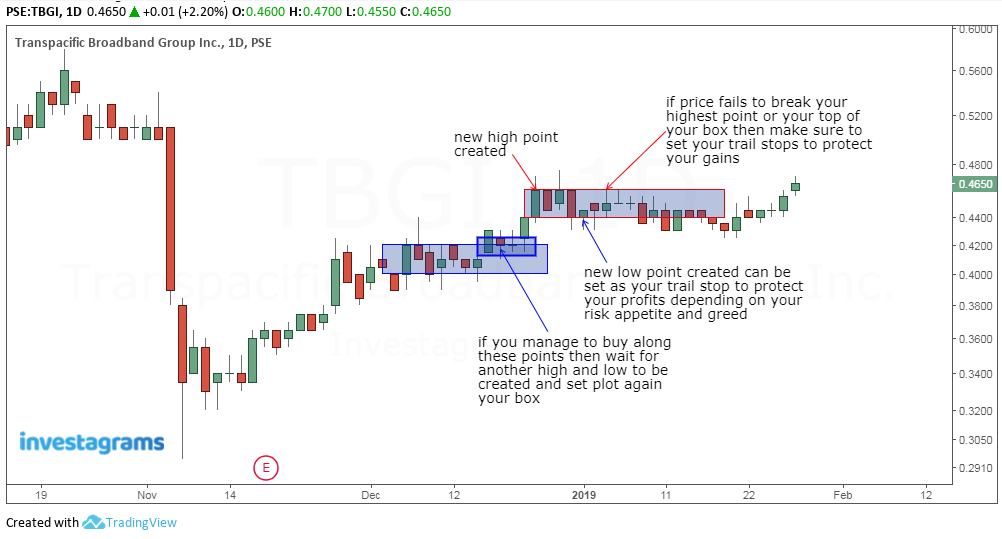
If the market sentiments is within your favor and created its new high then mark it as your top of your box and watch out for the lowest point it may create to complete your next box or 2nd box.
 |
| chart_from_investagrams |
 |
| chart_from_investagrams |
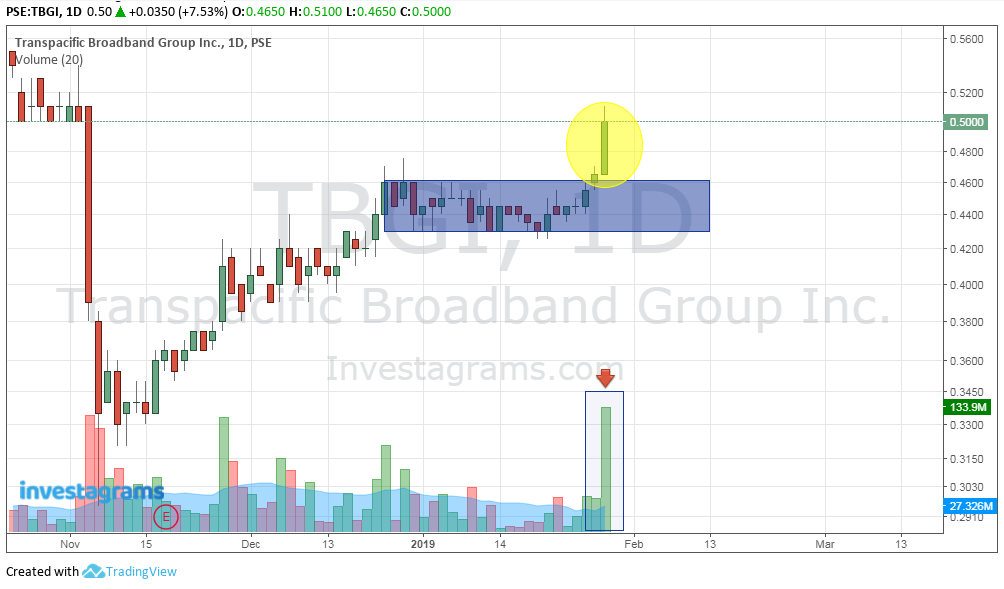
As of this writing January 29, 2019 (1:54pm time) TBGI chart broke out from our top box with volume.
 |
| chart_from_investagrams |
Using this simple strategy would be handy to be able ride such break outs and earn from the market if you do your homework.
STOCK: IRC
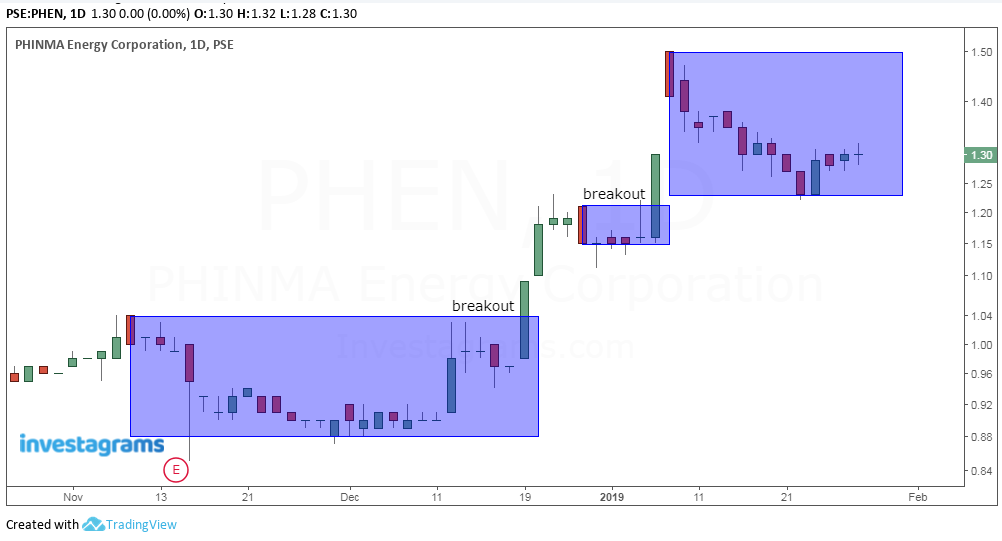
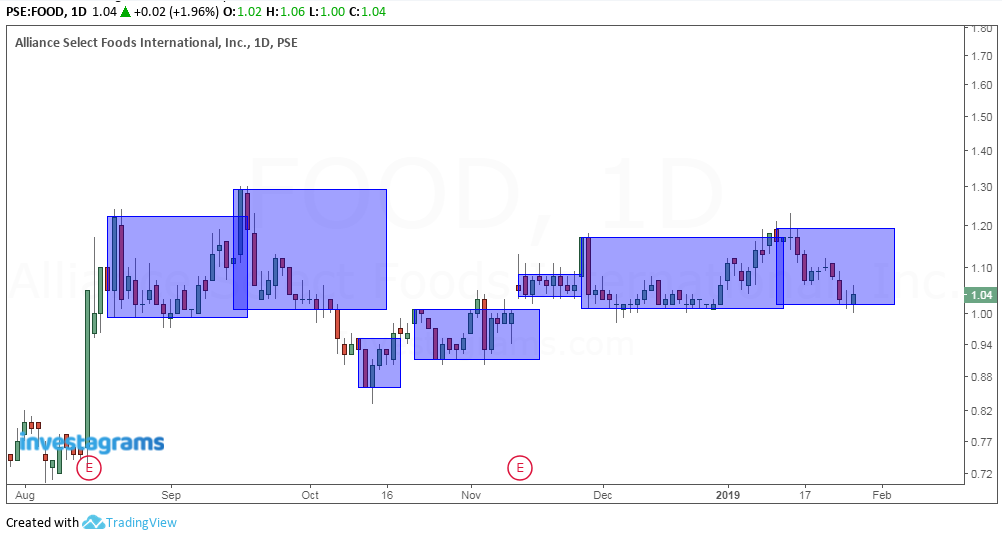
Now just play around with the box and set your own top and low that you think would be your trading range as there are no right or wrong when plotting your own box.
You need not to be too detailed nor meticulous when plotting your own, just simply drag the rectangle tool and set previous high and low from your chart that you see.
 |
| chart_from_investagrams |
 |
| chart_from_investagrams |
 |
| chart_from_investagrams |
 |
| chart_from_investagrams |
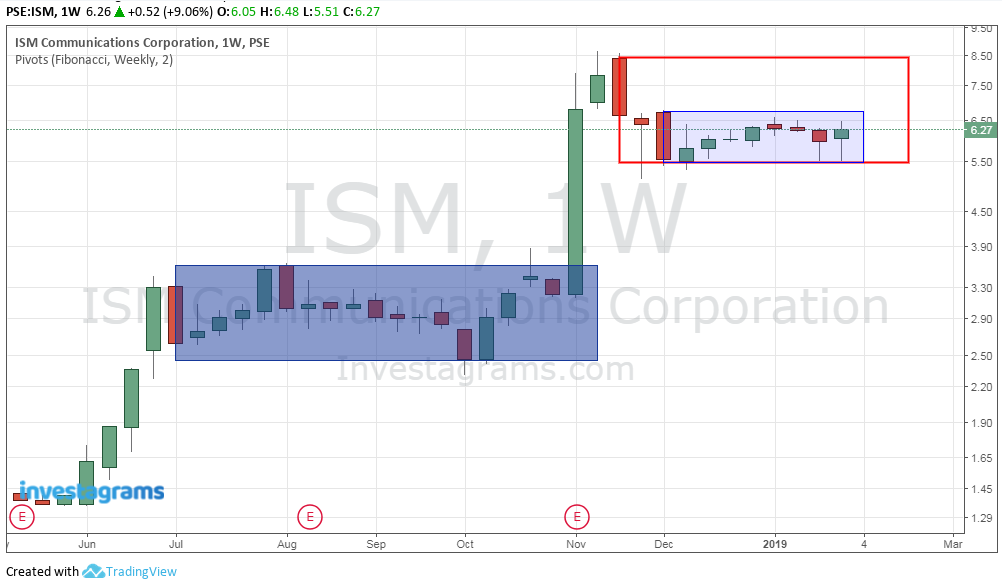
STOCK: ISM
 |
| chart_from_investagrams |
 |
| chart_from_investagrams |
Or as I have said you can check with other time frames to really get a bigger picture of what is happening on a particular stock and not to get too emotional with the daily fluctuations.
 |
| chart_from_investagrams |
STOCK: FGEN
You may add other indicators that you think would help you get an overall view to strengthen your conviction to help you plan your trades.
EMA 200 added to see if it's still bullish or not, don't be afraid to make your own combinations just don't over kill with too much clutter, just keep it simple since they are just guides for you to get a edge.
 |
| chart_from_investagrams |
That's how you will use those boxes to watch out for any breakout or breakdown easily without the hassle on using complicated indicators/oscillators if you are just beginning to study on how to trade the market.
You can do it with any time frames as you wish since these are just your guide and no definite rule on how to use them since at the end of the day the trader's/investor's that will play on a specific trading day will still decide the outcome and not by your plotted box.
Quite easy right? Just look for the highest point and lowest point then plot your boxes, the hard part? When you will set your own cut loss/stop loss points if it fails your box and your emotions gets in the way and fail to execute your plan.
He only uses the box as an edge to play the market and knows when to cut his losses to stay in the game but also knows how to ride the market when it pours money into his pockets.
No matter what tools you use say moving averages, bollinger, fibo, ichimoku and so on if you fail to execute your trade plan and let your ego then those edge you use won't work.
If you found this helpful, say thanks by sharing this site!


0 Comments