 I love reading other trader's style and try to learn from them. This time I want to feature another by the name Spyfrat, in real life is Sir Hernan Segovia.
Señor Spyfrat trading style only uses two indicators which we will try to decode and learn from this set up.
What I like from this system just by looking at your chart you're already given the idea where the market sentiment is currently heading knowing that Señor have been more than 2 decades in the market can we still doubt its efficiency?
So let's get started and check if this set up will fit our own trading style and somehow learn something from it.
So let's get started and check if this set up will fit our own trading style and somehow learn something from it.
THINGS NEEDED
➤Daily Time Frame
➤Weekly Time Frame
➤Bollinger Bands set values at 50, 0.20
➤RSI set to 30-period from the default 14 and set level 70 & 50 from the default 70-30
Conditions:
Here's a clear overview in chart
➤Daily Time Frame
➤Weekly Time Frame
➤Bollinger Bands set values at 50, 0.20
➤RSI set to 30-period from the default 14 and set level 70 & 50 from the default 70-30
Conditions:
- If bollinger bands below your prices=uptrend
- If bollinger bands above your prices=downtrend
- If RSI(30) above 50 level=uptrend
- If RSI(30) below 50 level=downtrend
- If both daily and weekly RSI(30) above 70 level=parabolic state
- If both daily and weekly RSI(30) above 70 level but daily RSI is greater than weekly=parabolic high risk (phr) which is subject to paraburst wherein price already at its toppish and subject for correction
- If both daily and weekly RSI(30) above 80 level regardless which is greater from the other=extreme parabolic high risk (ephr) which will also be subject for correction
- *best set up when RSI weekly is greater than RSI daily*
Here's a clear overview in chart
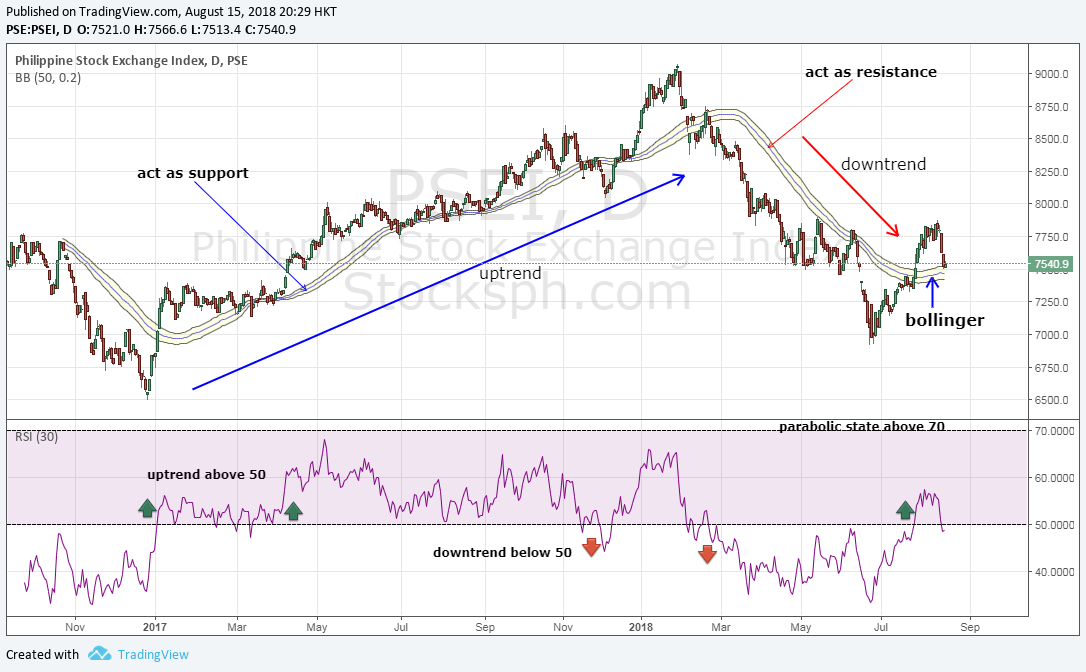 |
| Spyfrat_trading_system_(chart by Stocksph.com) |
Quite simple and easy right? We hope so when we are already on actual trading.
Disclaimer: Sample charts provided are for educational purposes only.
STOCK STUDIES:
Let's see some sample studies applying this system.
STOCK: ATN
Actually I already featured this stock from another trading set up using moving averages from another post just try to check it out from recent post.
Notice in Daily when RSI start moving up above 50 level with our bollinger band upper line still above prices yet our bollinger band median sat at 0.65 which is lower from its closed price at 0.66 acting as support.
(date: June 29,2018)
With this RSI condition already satisfied in Daily and bollinger band already near below prices.
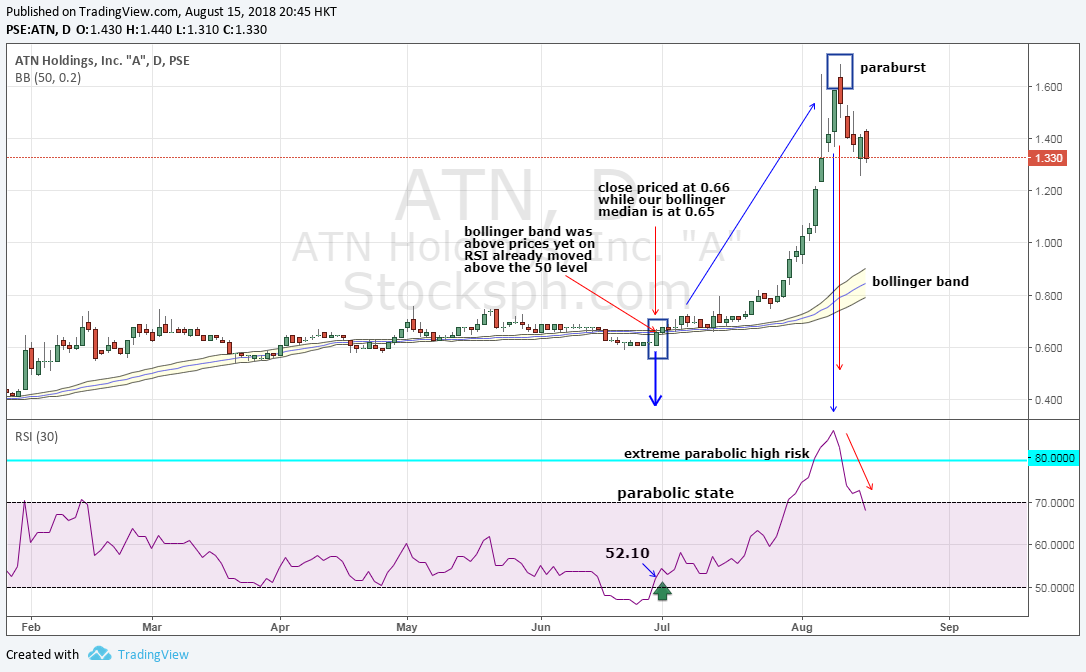 |
| Spyfrat_trading_system_ATN_daily(chart by Stocksph.com) |
A comparison with weekly time frame, RSI weekly was ahead from daily RSI with 59.32 against 52.10 respectively with weekly bollinger band met our conditions of positioning below our prices.
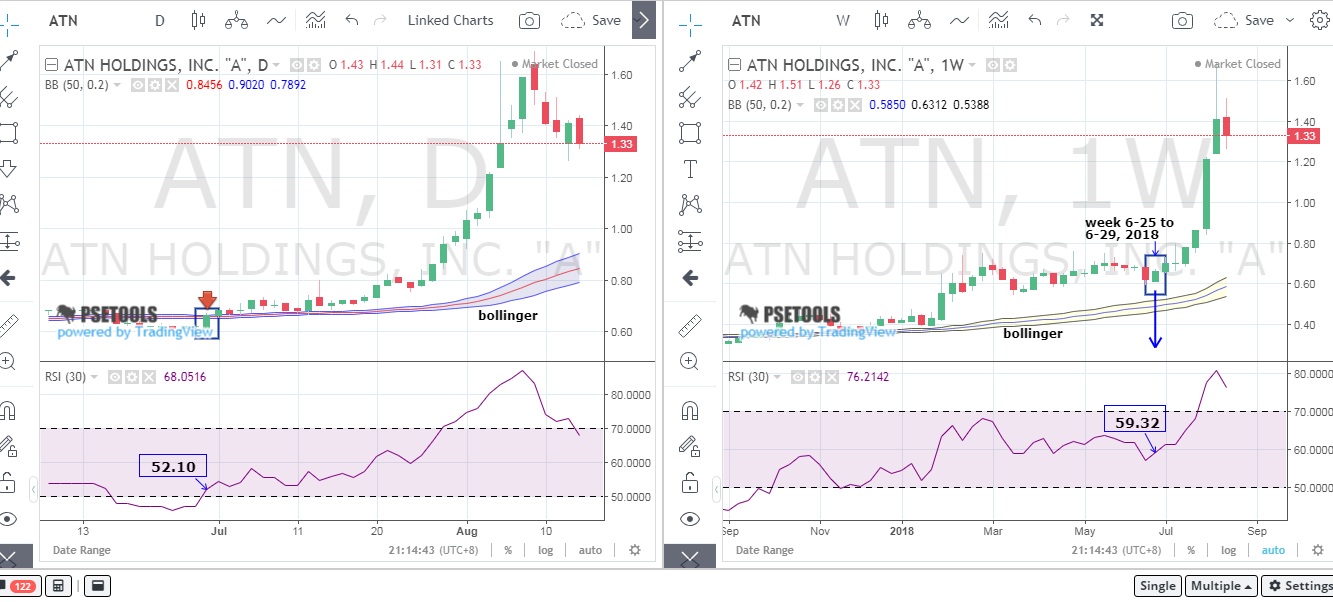 |
| Spyfrat_trading_system_ATN_daily_vs_weekly(chart by PSETools) |
On July 30, 2018 Daily RSI already entered parabolic state as shown below with 70.65 with weekly having RSI 77.55
While on August 6, 2018 Daily already entered ePHR (extreme Parabolic High Risk) even with weekly and after three days the sell off started.
While on August 6, 2018 Daily already entered ePHR (extreme Parabolic High Risk) even with weekly and after three days the sell off started.
 |
| Spyfrat_trading_system_ATN_daily_vs_weekly(chart by PSETools) |
When observing this stock during its parabolic stages the outcome of weekly and daily RSI was different instead of weekly ahead on daily, the daily RSI was ahead over weekly only after a week was completed that you can see that RSI weekly was greater than daily.
So at least wait for the week be completed to learn which RSI is ahead that is why I hesitated to enter the stock due to my readings that daily was ahead at that time if I was not mistaken.
The question now is when will you enter your position since it was not clearly stated by Spyfrat on entry points but just gave you an overview on how to play stocks on Parabolics.
Trying to trace back where the bollinger in weekly has stabilized was on the week of December 11-15, 2017 and if you notice on the two red candles which was still below RSI 50 level, as a rule you must wait for the 3rd day to avoid catching a falling knife if the price keeps dropping.
True enough with the 3 day rule, price move up above the 50 level and even with the bollinger in daily being touched by prices as long your bollinger in weekly is holding do not sell.
 |
| Spyfrat_trading_system_ATN_daily_vs_weekly(chart by PSETools) |
To be honest it's easy to tell when it already happened but in actual trading we really don't know what will gonna happen, but let this serve as a guide to study the past price action and who knows we may able to catch this kind of play. :)
STOCK: TBGI
Take note that ATN and TBGI have the same chairman Arsenio T. Ng and ATN simply the acronym of the chairman himself as per rumors.
If you notice from chart another 2 red candles were spotted before the break out on the 3rd day, so the 3 day rule really is handy if you can spot this one.
Even on a selling spree for two days you can observe the RSI above 50 level was holding in daily with the support of the bollinger band below the prices.
You will also spot that on daily it failed to go above the 70 level (parabolic state) almost twice attempt will there be a 3rd try?
Again the question when was the best entry? If you notice on weekly on the 1st break out that was the same week of December 11-15, 2017 with ATN. Coincidence? Not really, remember both have only one chairman.
Observing this stock, this I can attest that RSI weekly was way ahead on RSI daily that is why I was able to pick up along 0.58 and sold at 0.75 that's pure 27.78% profit.
At the moment (to this writing) RSI weekly still greater than daily with 64.65 vs 59.59 respectively. Supports along 0.64 to 0.65 still holding besides we still have the bollinger band as our main support.

~END~
STOCK: TBGI
Take note that ATN and TBGI have the same chairman Arsenio T. Ng and ATN simply the acronym of the chairman himself as per rumors.
 |
| Spyfrat_trading_system_TBGI_daily_vs_weekly(chart by PSETools) |
If you notice from chart another 2 red candles were spotted before the break out on the 3rd day, so the 3 day rule really is handy if you can spot this one.
Even on a selling spree for two days you can observe the RSI above 50 level was holding in daily with the support of the bollinger band below the prices.
You will also spot that on daily it failed to go above the 70 level (parabolic state) almost twice attempt will there be a 3rd try?
Again the question when was the best entry? If you notice on weekly on the 1st break out that was the same week of December 11-15, 2017 with ATN. Coincidence? Not really, remember both have only one chairman.
Observing this stock, this I can attest that RSI weekly was way ahead on RSI daily that is why I was able to pick up along 0.58 and sold at 0.75 that's pure 27.78% profit.
At the moment (to this writing) RSI weekly still greater than daily with 64.65 vs 59.59 respectively. Supports along 0.64 to 0.65 still holding besides we still have the bollinger band as our main support.
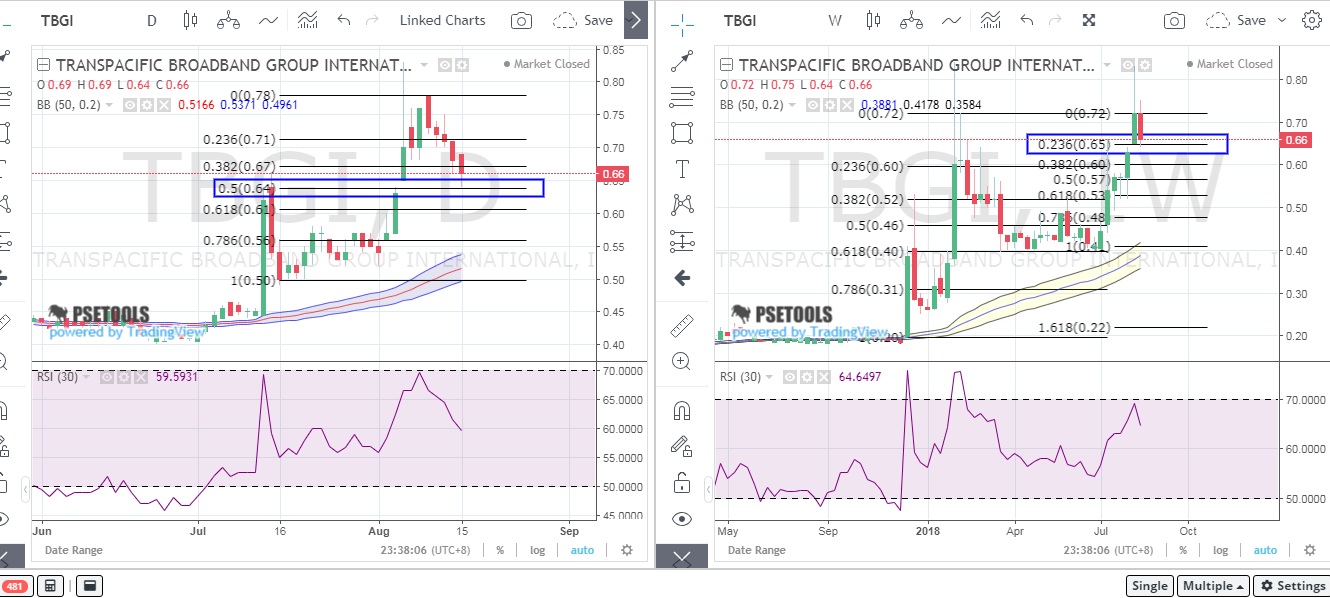 |
| Spyfrat_trading_system_TBGI_daily_vs_weekly_supports(chart by PSETools) |
~END~

Now I leave to you some stocks for your own review if you did understand how Spyfrat set up works and try to find any support and resistances if you wish to enter a position.
In case it satisfies our conditions using his system then do your homework where would be the best entry points so you can position early.
I prefer to use Fibonacci to confirm support and resistance levels if in case I miss out the early rallies and wait if it will give me some opportunity, check this post on how to use fibo.
Below I supplemented with MACD histogram and DMI for confirmations to get the idea if momentum is still strong and for possible shift of trend on some follow through charts (EOD).
Again if you spot some selling points do not enter a position yet and wait for the 3rd day if the trend will reverse. TAYOR!
FOR YOUR ANALYSIS and STUDY
STOCK:ISM
A follow through chart for ISM 8162018 EOD
In case it satisfies our conditions using his system then do your homework where would be the best entry points so you can position early.
I prefer to use Fibonacci to confirm support and resistance levels if in case I miss out the early rallies and wait if it will give me some opportunity, check this post on how to use fibo.
Below I supplemented with MACD histogram and DMI for confirmations to get the idea if momentum is still strong and for possible shift of trend on some follow through charts (EOD).
Again if you spot some selling points do not enter a position yet and wait for the 3rd day if the trend will reverse. TAYOR!
FOR YOUR ANALYSIS and STUDY
STOCK:ISM
 |
| Spyfrat_trading_system_ISM_daily_vs_weekly(chart by PSETools) |
A follow through chart for ISM 8162018 EOD
 |
| ISM_daily_vs_weekly_EOD(chart by PSETools) |
August 22, 2018 my bid at 2.85 was not hit (barat kasi) but just spotted Mandarin buying at 2.97+ it's up to you to connect the dots, do they know something? But my bid price was based from my own system and not on "broker information analysis" anyway, it's your own choice if you ride with them.
STOCK: IRC
A follow through chart for IRC 8162018 EOD
STOCK: MRC
 |
| Mandarin_ninja_moves_on_ISM_August_22_2018 |
STOCK: IRC
 |
| Spyfrat_trading_system_IRC_daily_vs_weekly(chart by PSETools) |
A follow through chart for IRC 8162018 EOD
 |
| IRC_daily_vs_weekly_EOD(chart by PSETools) |
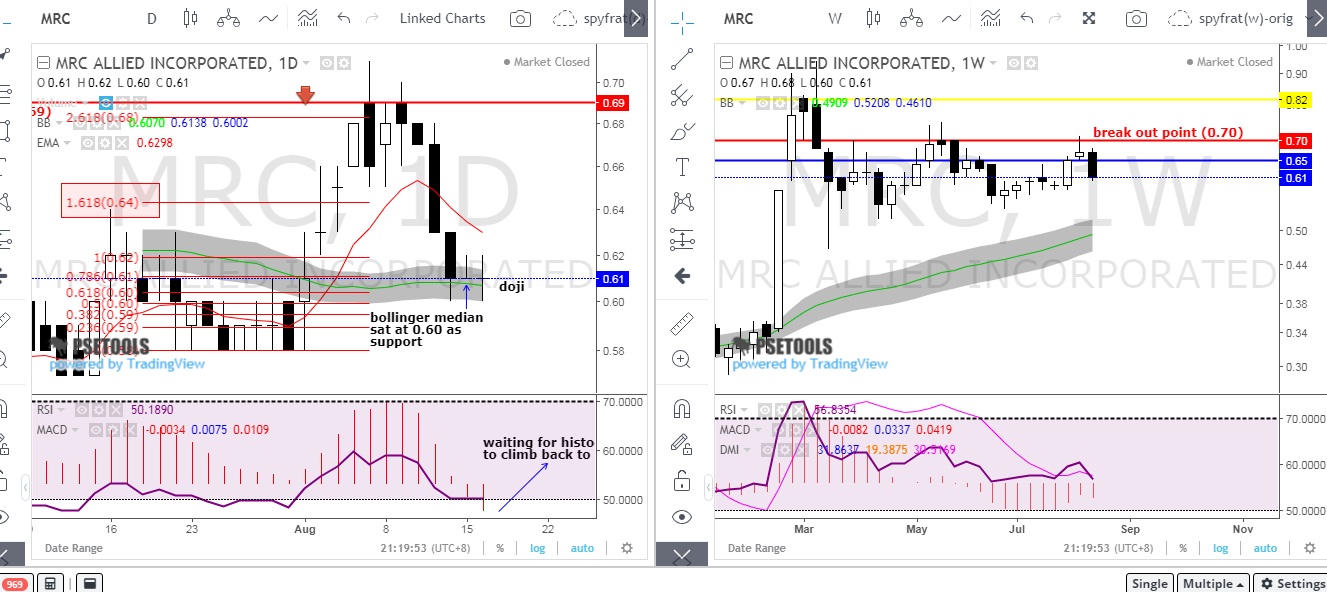
STOCK: MRC
 |
| Spyfrat_trading_system_MRC_daily_vs_weekly(chart by PSETools) |
A follow through chart for MRC 8162018 EOD
STOCK: FOOD
 |
| MRC_daily_vs_weekly_EOD(chart by PSETools) |
STOCK: FOOD
 |
| Spyfrat_trading_system_FOOD_daily_vs_weekly(chart by PSETools) |
A follow through chart for FOOD 8162018 EOD
STOCK: ION
 |
| FOOD_daily_vs_weekly_EOD(chart by PSETools) |
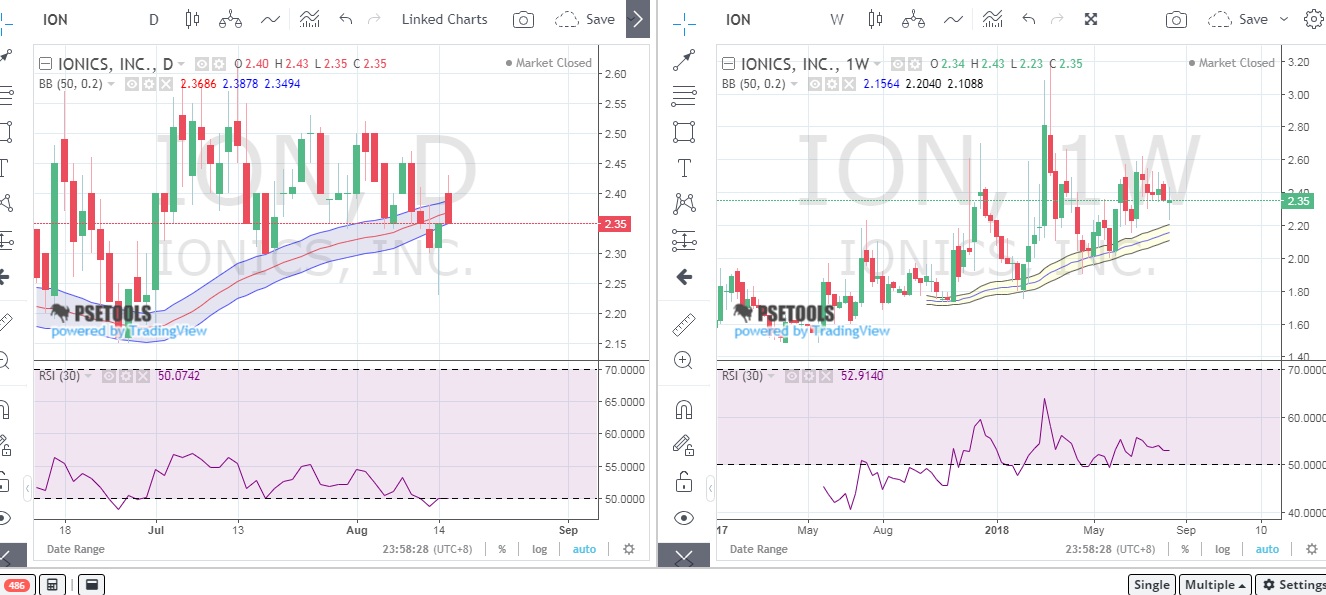
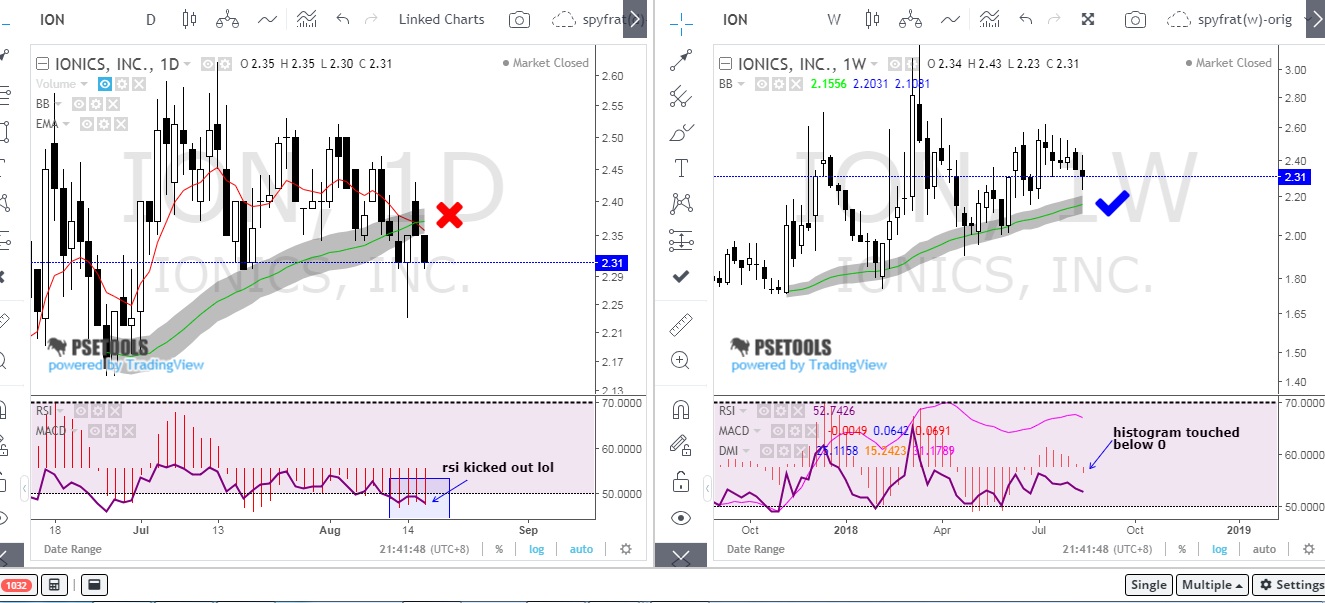
STOCK: ION
 |
| Spyfrat_trading_system_ION_daily_vs_weekly(chart by PSETools) |
A follow through chart for ION 8162018 EOD
STOCK: ABA
STOCK: HOUSE
STOCK: T
STOCK: BKR
STOCK: RWM
 |
| ION_daily_vs_weekly_EOD(chart by PSETools) |
STOCK: ABA
 |
| Spyfrat_trading_system_ABA_daily_vs_weekly(chart by PSETools) |
STOCK: HOUSE
 |
| Spyfrat_trading_system_HOUSE_daily_vs_weekly(chart by PSETools) |
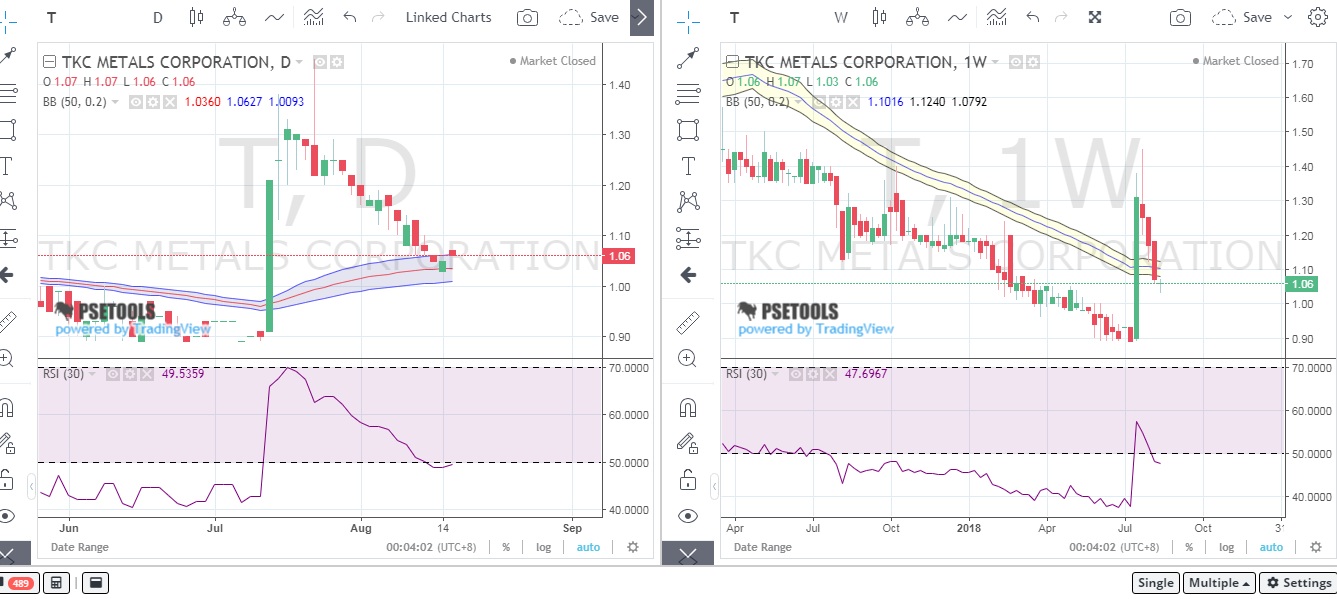
STOCK: T
 |
| Spyfrat_trading_system_T_daily_vs_weekly(chart by PSETools) |
STOCK: BKR
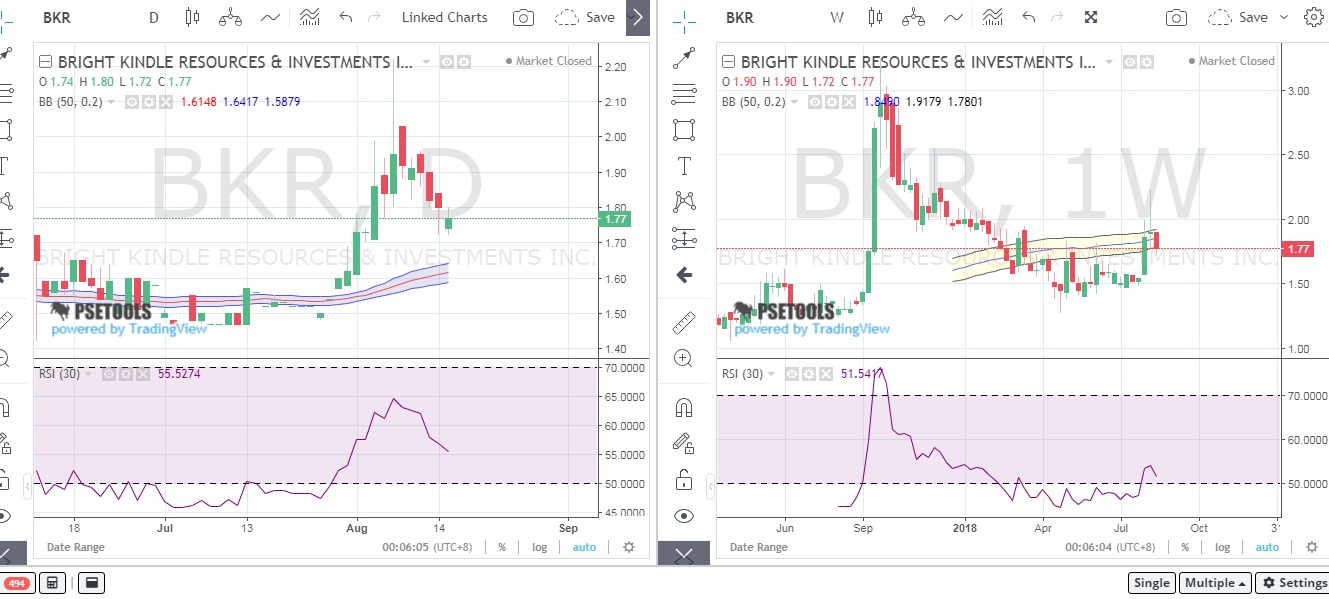 |
| Spyfrat_trading_system_BKR_daily_vs_weekly(chart by PSETools) |
STOCK: RWM
 |
| Spyfrat_trading_system_RWM_daily_vs_weekly(chart by PSETools) |
STOCK: BCOR
If traders only know how to spot real break outs with the help of bollinger.
QUICK SCREENING USING Spyfrat
Sample stocks to avoid as much as possible until they completely meet the Daily and Weekly conditions only include them on your watch list when they gain momentum particularly on weekly bollinger and rsi.
This is the fastest way to screen your winning stocks without the hassle on going for number of data like near 52wk high/low, above ma20, ma50, ma100, rsi on overbought or oversold, net foreign buying etc.
What you see is what you get, make it simple when you try to screen and filter your stocks it's telling you already of a story of what happened during the day and previous weeks.
If traders only know how to spot real break outs with the help of bollinger.
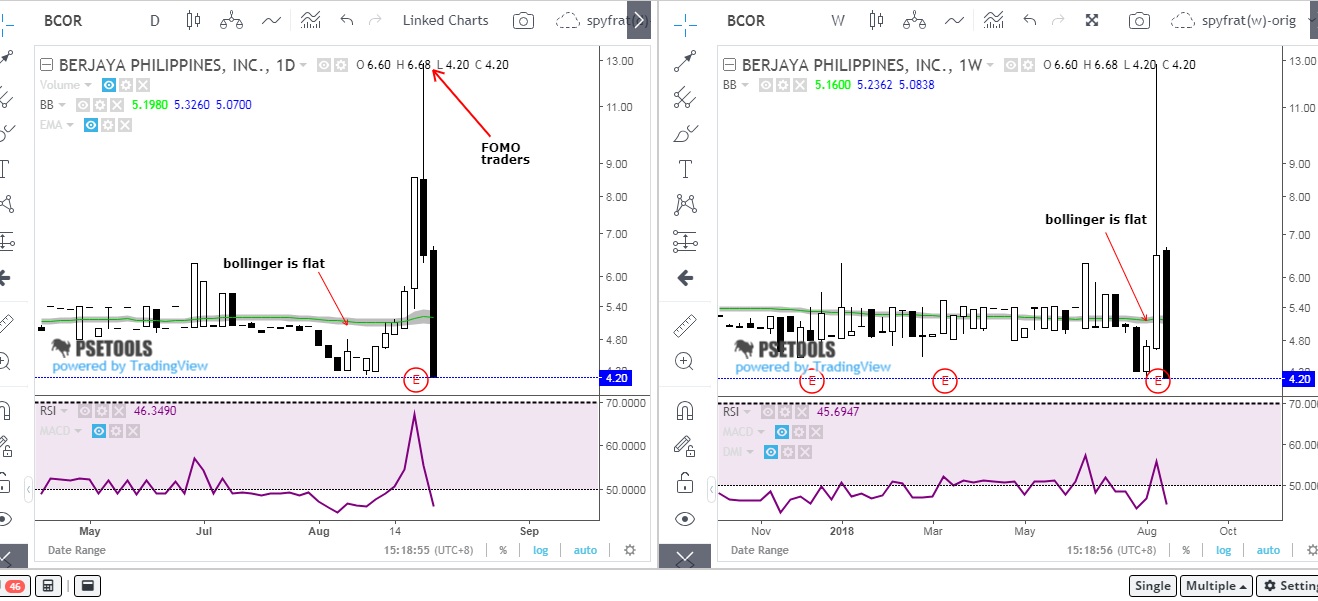 |
| Spyfrat_trading_system_BCOR_daily_vs_weekly(chart by PSETools) |
QUICK SCREENING USING Spyfrat
Sample stocks to avoid as much as possible until they completely meet the Daily and Weekly conditions only include them on your watch list when they gain momentum particularly on weekly bollinger and rsi.
This is the fastest way to screen your winning stocks without the hassle on going for number of data like near 52wk high/low, above ma20, ma50, ma100, rsi on overbought or oversold, net foreign buying etc.
What you see is what you get, make it simple when you try to screen and filter your stocks it's telling you already of a story of what happened during the day and previous weeks.
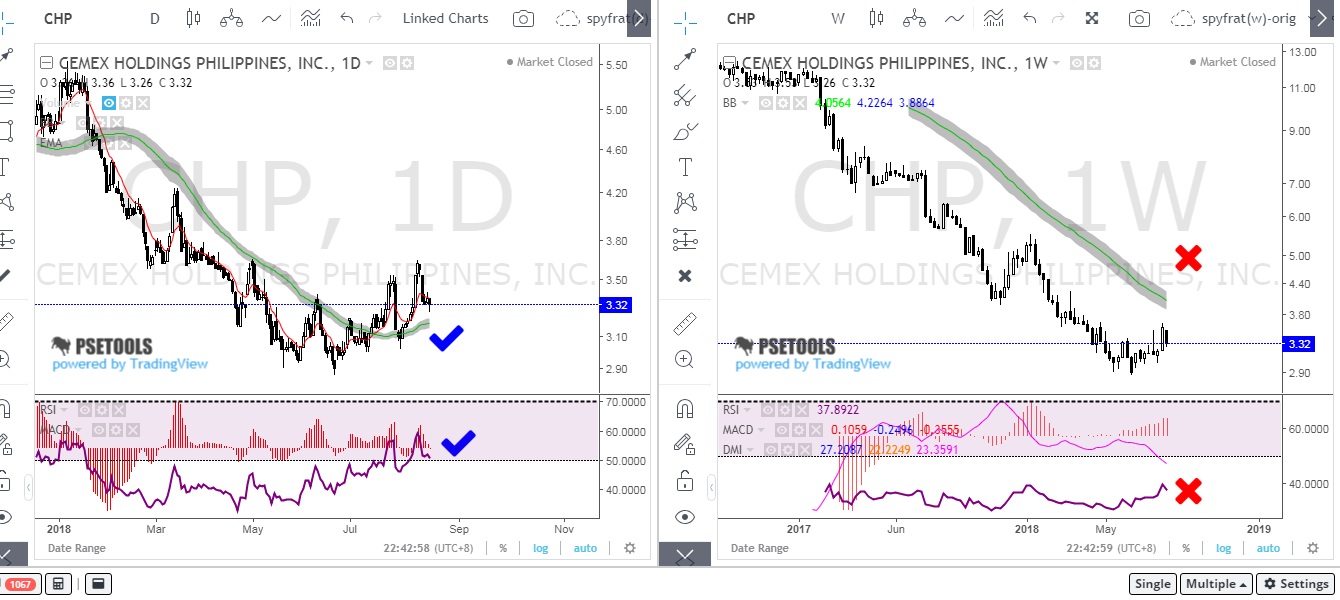 |
| avoid_as_of_the_moment(chart by PSETools) |
 |
| avoid_as_of_the_moment(chart by PSETools) |
 |
| avoid_as_of_the_moment(chart by PSETools) |
 |
| avoid_as_of_the_moment(chart by PSETools) |
 |
| avoid_as_of_the_moment(chart by PSETools) |
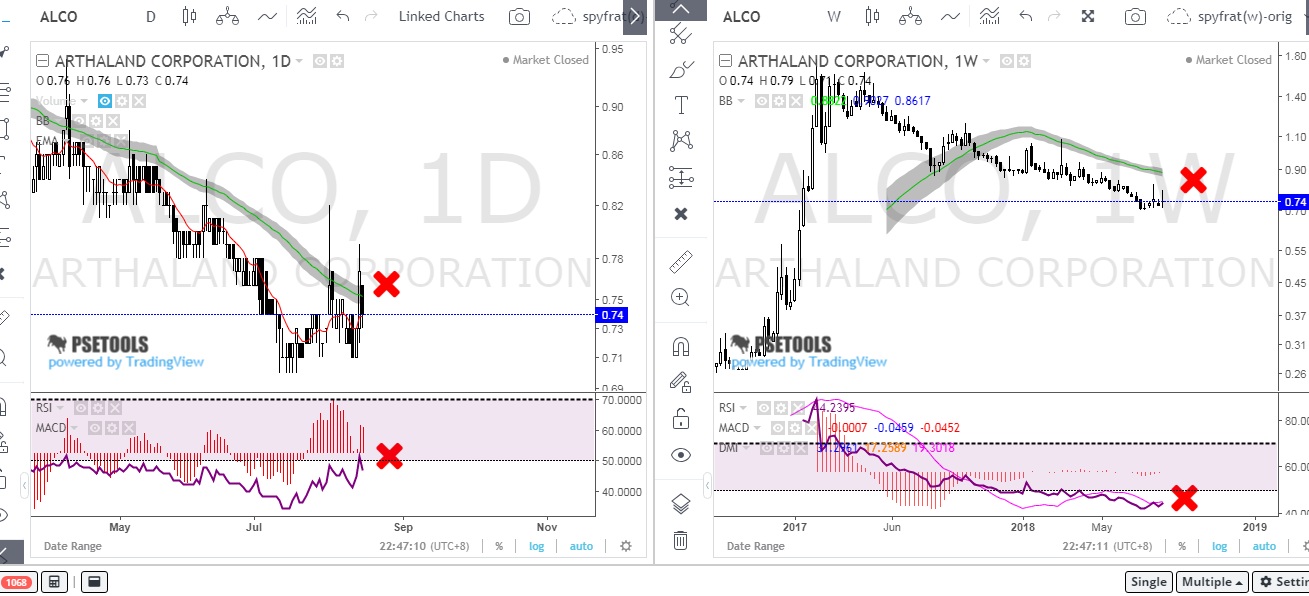 |
| avoid_as_of_the_moment(chart by PSETools) |
 |
| avoid_as_of_the_moment(chart by PSETools) |
 |
| avoid_as_of_the_moment(chart by PSETools) |
 |
| avoid_as_of_the_moment(chart by PSETools) |
These are just based on my own understanding and interpretation on the system it's up to you on how you will manage to get the idea our Señor has shared with us.
Try to review and see if this set up will work on your trades and don't be too hasty, learn digest and see strong points or weakness if you can find one and try to innovate that will work out for you.
The weekly trend will be your biggest friend, while the daily to spot good entries will be your greatest nightmare. :)
Here's the link on a short video from señor himself for further study.
Check out also this short video tutorial on how you will play with your charts and customized to your own liking.
If you find this helpful, say thanks by sharing this site!


4 Comments
Sir Spyfrat napakalaking tulong po itong blog nyo sa gaya naming newbie sa trading. Salamat po at Godbless...
ReplyDeleteglad it helps, by the way also a fan of senyor Spyfrat :) Happy trading!
ReplyDeleteYung sa Bollinger Bands (50, 0.20) wala bang kasamang upper and lower deviations?
ReplyDeleteHi sorry for the late reply, with senyor's settings no longer needed as it will look like a Moving average, all you need to do is to observe if it's below your prices shows a strong demand by the buyers (bullish) and if it reverse on the upper side means sellers overwhelm the buyers (bearish)which is just a quick way to check the trend.
ReplyDelete