Once you know the trend of the market, the next thing you need to look for in your chart would be the major "Support" and "Resistance" levels.
Through the test of time human nature has not changed and that is why it creates the same pattern over and over as one quotes of a famous trader.
This can be validated by looking at some stocks from their trading history.
Disclaimer: Sample charts provided are for educational purposes only.
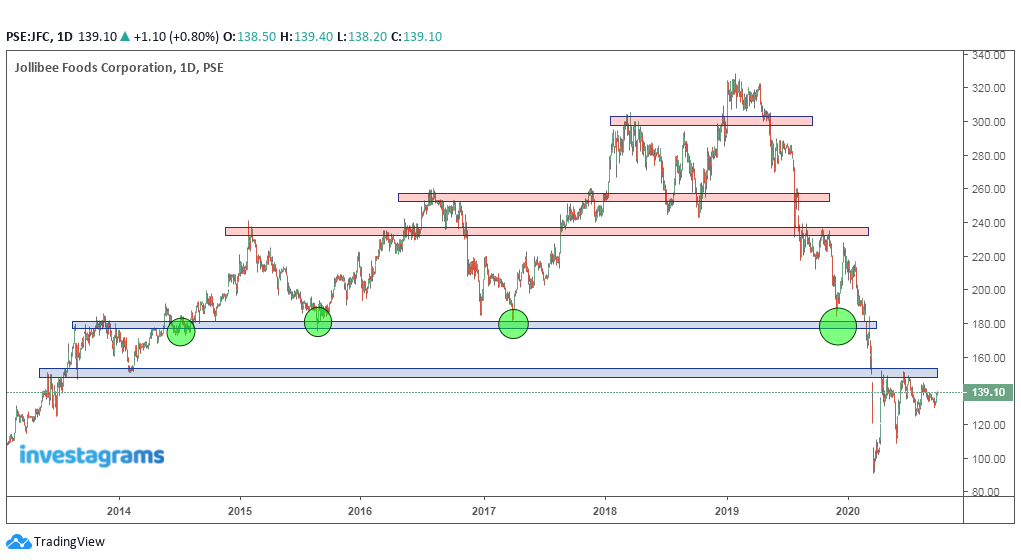
STOCK: JFC
 |
| chart_from_investagrams_JFC |
Sample chart of JFC above as you can see from 2014 up to the present time (as of this writing) when you try to draw horizontal lines or draw rectangle areas you will notice where the market reacted based from previous high and lows.
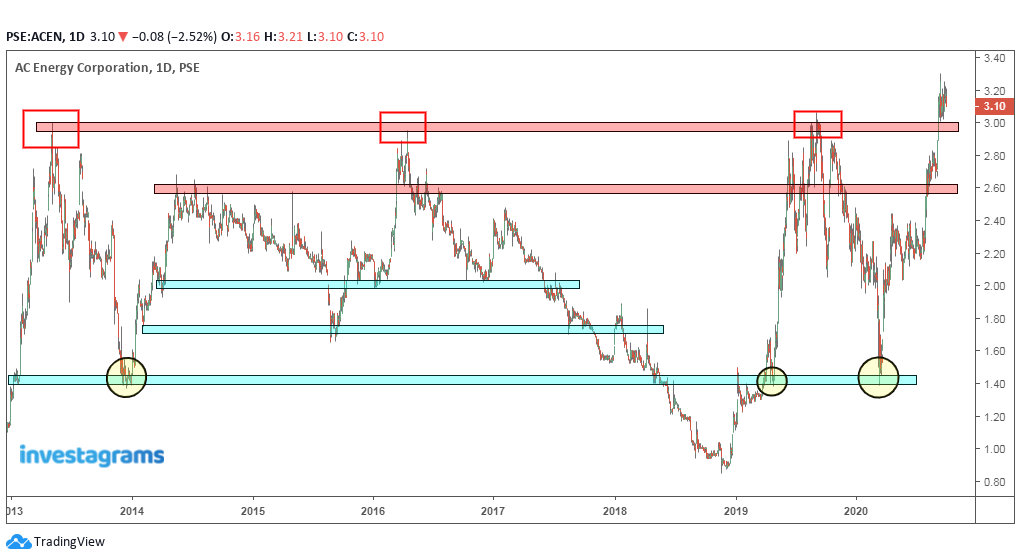
STOCK: ACEN
➤from PHEN to ACEPH and ACEN from 2013 to present (as of this writing) performance in the market.
 |
| chart_from_investagrams_ACEN |
If you can pinpoint those major support and resistance levels, at least you can plan ahead where you will be picking up some shares and where your target price to make profit.
This is very basic for every trader and you should start from this first before you add those decorative indicators as added conviction to your trades later on.
To summarize, Support where price bounce and moves up and Resistance the reverse where price reach a certain peak and drops down.
So simply buy near a support level and sell at resistance.


0 Comments