Find support and resistance using pivot point calculator for your trading, either on making trades on 5-30-60 minutes to daily chart time frames.
First download excel file of Pivot Point Calculator here or below of this page. Now simply open up your broker's chart or any online charts from other websites like investagrams, financemanila , psetools etc.
The first 3 charts above are the basic pivot point calculator while underneath are the Fibonacci pivot point calculators computed at 0.382(S1-R1), 0.618 (S2-R2), 1.00 (S3-R3) levels. Source of computations here.
Open your chart and set to 1 day time frame and go to your last candle stick or bar, and copy the values H,L,C
 |
| 1_day_chart_frame |
Now input from pivot calculator the values taken from 1 day chart time frame.
 |
| input_values |
If you will be trading on a 5min, 10min to 15min chart time frames you will now try to anticipate your entries at ₱4.50 to ₱4.77 (support) and try to sell around ₱5.04 to ₱5.31 (resistance) where ₱4.92 as your pivot point or turning point if it goes below/above your computed estimated support and resistance respectively. Data good for a day only.
 |
| support_&_resistance |
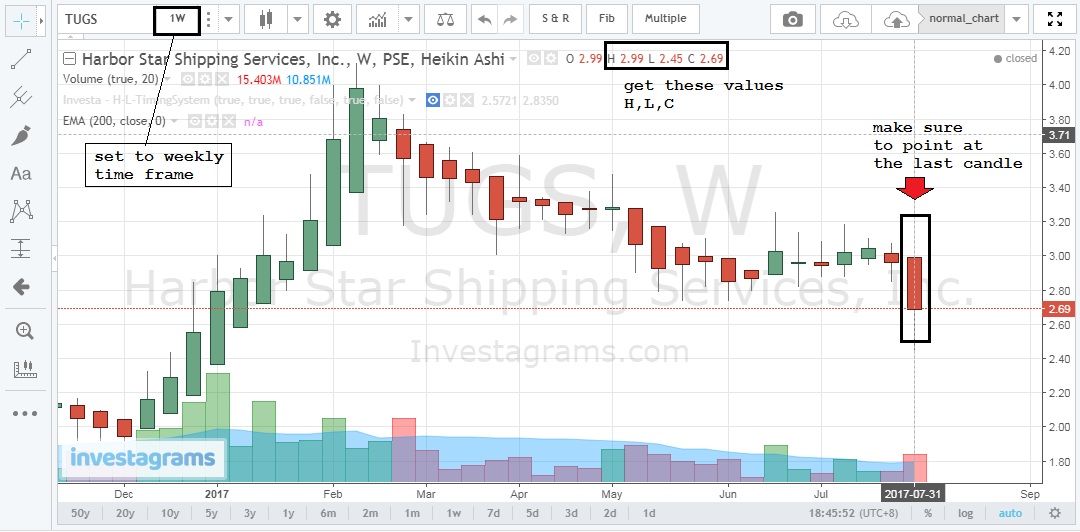
Same procedure for weekly chart time frame (when trading at 30-60min charts) as above.
 |
| 1_week_chart_frame |
Anticipate your support along ₱1.89 to ₱2.43 and resistance along ₱2.97 to ₱3.51 when trading at 30-60min chart time frames with your turning point along ₱2.71 and these data good for 1 week only.
 |
| support_&_resistance |
...and monthly chart time frame (trading on daily charts) following steps above. S&R with PP good for a month.
If you find this helpful, say thanks by sharing this site to others!
 |
| 1_month_chart_frame |
If you find this helpful, say thanks by sharing this site to others!
Get your pivot calculator now.


0 Comments