

If you're just starting from stocks you should have come across with our very own Filipino trader by the alias Señor Spyfrat but known in real life as Sir Hernan Segovia. If not don't miss out to look for his blog "Spyfrat's Call" and try to learn more on his "bebemon" and "fractal structure".
What am going to cover is just the old setup I learned on my early years of trading after running through Señor Spyfrat's blog based on my own interpretation and understanding.
Señor simply utilize the bollinger bands and RSI on a Daily and Weekly time frames, make sure to setup these values:
➤bollinger bands=(50,0.20)
➤rsi=30 length, 70 & 50
Conditions/Theory:
❤Parabolic state (PS)**=when both D&W RSI are above 70 (best set up W>D)
❤Parabolic high risk (PHR)*=when both D&W RSI are above 70 but daily is greater than weekly.
❤Extreme parabolic high risk (EPHR)*=when both D&W RSI are above 80 regardless of which time frame is greater.
added notes:
➤a. Uptrend=when price above BB and RSI 50
➤b. Downtrend=when price below BB and RSI 50
*subject for correction, by theory price already at its toppish.
**when in PS by theory it defies gravity and no room for overbought concept.
Short video from Señor himself
Disclaimer: Sample charts provided are for educational purposes only.
STOCK: ACEN
➤sample chart of ACEN simply satisfies letter "a" under notes above.
➤has not yet fulfilled "parabolic state" with RSI still below 70, but good sign of RSI W greater than D.
➤plus if you look closely in weekly it has the potential to break another previous high (resistance) so pay attention to daily support if able to hold on that area.
➤notice on the daily RSI attempted above 70 but failed and had its pullback which is likely to happen always with an RSI 30 based from what I observed for every stock.
➤very rare do I see a stock that goes beyond the 70 area without bumping its head first (umpog ba?)
 |
| chart_from_investagrams |
➤same with ACEN it complied with letter "a" under notes.
➤the daily made it to parabolic high risk nearing EPHR with weekly behind, just below 70 mark which may signal already at its "toppish" despite of bollinger in weekly just about to establish itself.
➤if the theory is right then let's observe if it will make its pullback for the coming weeks.
➤notice how many times it bump the 70 mark making this the 4th attempt to stay above 70 after its last three tries previously in the daily time frame.
➤in these kind of plays, be vigilant on previous supports and resistance as you may never know when crazy fellow trader kills the fun. rofl
 |
| chart_from_investagrams |
➤another stock that met the conditions with letter "a" under notes.
➤highly traded with volume but somehow it's a slow moving stock for me.
➤the only I like about this stock is its cash dividend yearly where you receive twice.
➤aside from it broke from a previous high in daily it created gap from its previous closing price.
➤from weekly so far it made a solid support along ₱3.00 and attempts to break out from a previous high.
➤while its weekly rsi just broke above 50 must be carefully monitored since its still considered as its resistance level coming from below.
 |
| chart_from_investagrams |
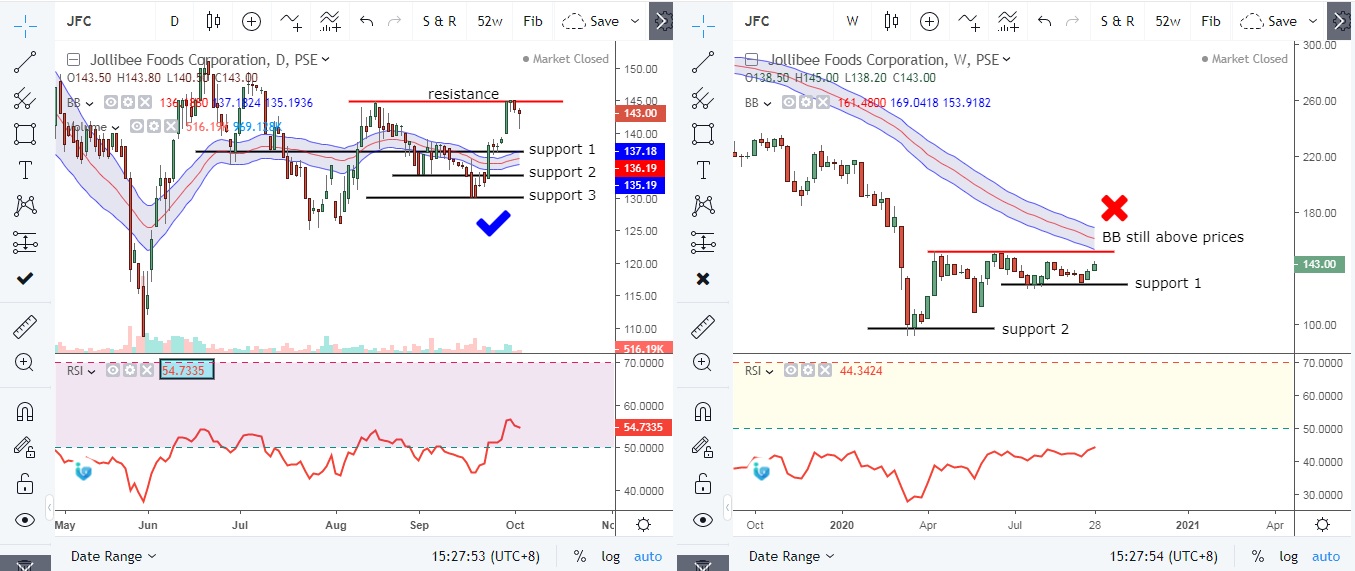
➤only the daily passed one criteria with the BB positioned below prices with rsi above 50 but take note of its formation almost dead flat which still in sideways.
➤a tough resistance still hard to break above ₱145 area in daily with weekly supports still holding along ₱128-₱130 levels (support 1).
➤still add JFC to your watch lists until both daily and weekly met given standards above and try to pick up among the 3 support areas when strong reversal take shape in your weekly.
 | |
|
Just to give you of an overview of the Bebemon setup, almost the same with your triangle patterns but Señor and team just come up with a name which they took from a duck's bill or its beak.
Usually should come from a beaten market when this starts to form with your BB to slowly constrict and start to position under your prices before a breakout to happen.
STOCK: ACEN
 |
| chart_from_investagrams |
Some final thoughts, the bollinger and rsi are your added confirmations to give you a clearer picture of the market.
Trying to remove the two you can still perform your basic support and resistance levels but when applied it makes it easier to filter which stocks are uptrend and downtrend.
Make it a habit to use these as "tools" to get an edge from the market and not to put expectations that these will give you 100% profits as it would depend on how you execute your trade plans.
I do hope you learn something and keep exploring until you find your own style that suits you best.


0 Comments