Jesse Livermore you heard the name, the Boy Plunger, the Boy Wonder of Wallstreet. Even if we are not trading on Wallstreet the lessons he left behind would still be of great use to guide us on our journey and simplify the trading process.
“Prices, as we know, will either move up or down according to the resistance they encounter. For purposes of easy explanation we will say that prices, like everything else, move along the line of least resistance.”
Try to research more and get to know the so called "Livermore Master Key" as different traders tried to decode this system to the present day.
This is my own interpretation and setup of the master key using the Keltner Channels adding a fibo pivot point.
More or less it looks like the normal bollinger bands but with a different approach on computation of its bands.
Daily
➤3 sets of KC on length 20, with mult of 1, 2, 3 per KC
➤pivot-weekly fibo
Weekly
➤3 sets of KC on length 20, with mult of 1, 2, 3 per KC
➤pivot-monthly fibo
Conditions:
➤Outermost on top band may signal "overbought" threshold and lowest band may signal "oversold" area.
➤wait for the pivotal point to arrive before you start to trade.
Disclaimer: Sample charts provided are for educational purposes only.
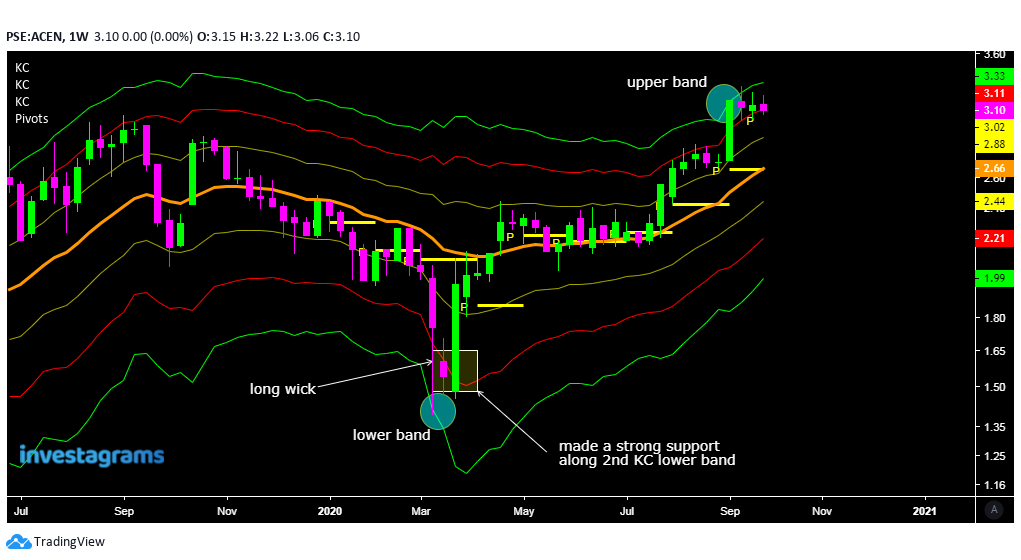
STOCK: ACEN
➤looking at the candle dated 13-March-2020 price touched down with the lowest band of our 3rd KC which may signify as the oversold area and awaits reversal confirmation.
➤after its bounce from band was not strong enough to break the pivot area and made a pullback before it stayed above our new pivot area.
➤as price rallied surpassing the median up to the outermost band before it traded sideways.
notice how it touches the lower bands of the 1st and 2nd KC.
➤comparing on its weekly, you can see buying pressure occurred with the long wick of the candle coming from the lower band.
➤until such time it created a solid support from the lower band of the 2nd KC.
momentum still intact with the pivots still under prices.
 |
| chart_from_investagrams_ACEN |
 |
| chart_from_investagram_ACEN_weekly |
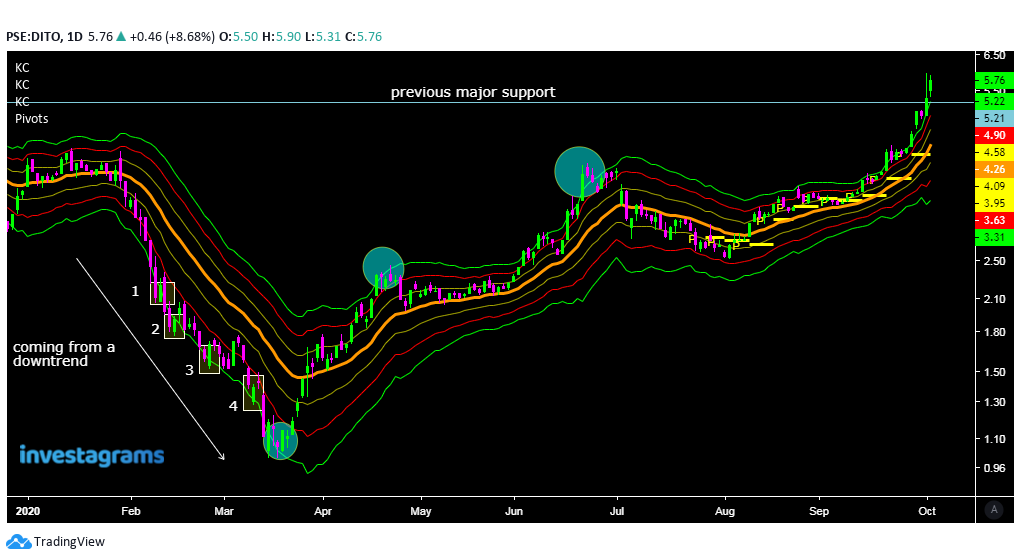
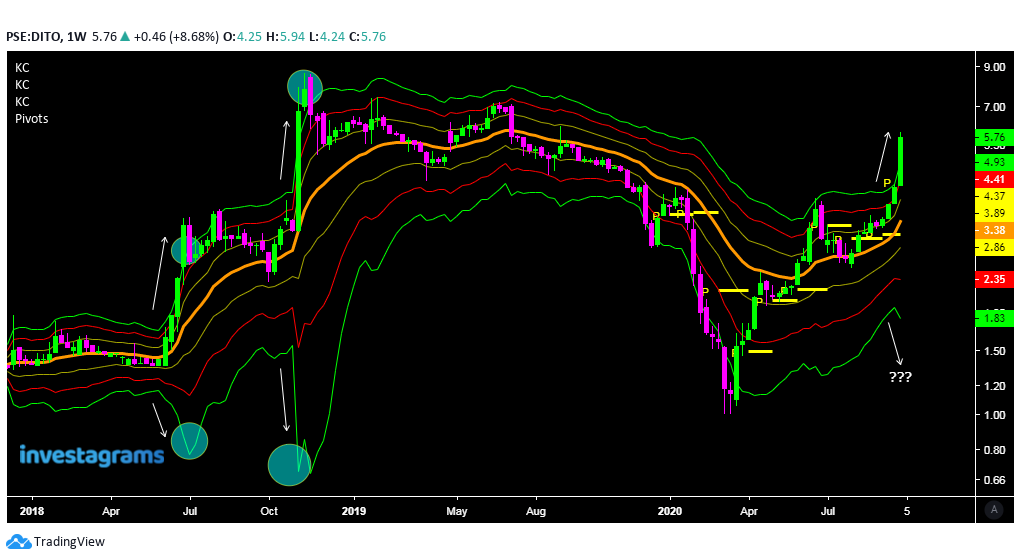
STOCK: DITO
➤look how it retested the lower bands and on the 6th try it finally had its momentum.
➤same with bollinger bands where price touches the upper bands tend to make some pullbacks.
➤compare from weekly prices where it created its support and notice how price spike as the bands starts to widen.
➤same with bollinger bands where price touches the upper bands tend to make some pullbacks.
➤compare from weekly prices where it created its support and notice how price spike as the bands starts to widen.
 |
| chart_from_investagrams_DITO_daily |
 |
| chart_from_investagrams_DITO_weekly |
Now have a try with other stocks if you can spot some bounce from its lower bands and much better if it is above your pivot point for stronger momentum or make some buy tests after a bounce from the lower bands, your call.
“The human side of every person is the greatest enemy of the average investor or speculator”-Jesse


0 Comments