“Failure is simply the opportunity to begin again, this time more intelligently.” – Henry A. Ford
The great lesson that we can get is that they never quit but moved forward and learned from those failures to which as newbies in the market can also be applied.
I have read some stories about new traders quit after they got wiped out but also read well experienced traders had the same thing and yet they stood up and pick up the pieces to come with a better mindset.
Well most newbies want instant profits once they jump into stocks but as I recall one of my professors in college once wrote from the board the word "Learn" and said..."you must first Learn...(then erased the letter L) before you Earn".
Quite true that most of us from the start forget to learn first the process but more focused on how much profit we can make. From here alone we already neglected applying risk management since this is the very first thing we need to survive from the volatility of the market.
Risk management starts from learning first the very basics on how to go about the market and not just rely on reco's, hearsay, hype etc, you need to learn it yourself on how did your proclaimed gurus or brokers come up with such data like... buy on this level or sell on level etc.
Through daily practice or observance of the market try to come up with your own system as everyone has its own style and what you read from other traders may not fit you, that is why only adapt what you think best suits you as you journey to your learning process.
Try to learn from other trader's mistakes and make sure not to commit those same mistakes to avoid undergoing from what they call as "baptism of fire" as some experienced traders have their own blogs where they shared their own journey in stocks.
Buying in tranches to test the waters is another way to lessen your risk in case the market goes against you, plus giving you some room for other flying stocks with some buying power left and not exhausting all your funds.
Cost averaging? Well this won't save you from a bear market and will only hurt your portfolio but applying cut loss and try to buyback for a possible entry is much more worth it.
Protect your gains by locking in your profits (LIP), when you're holding a particular stock that already gave you an attractive profit you may start selling portions to make your unrealized gains to real cash.
Do not wait for a reversal in trend that will deplete your gains, this way you will be able to control your Greed and not wait for disaster to happen.
Disclaimer: Sample charts provided are for educational purposes only.
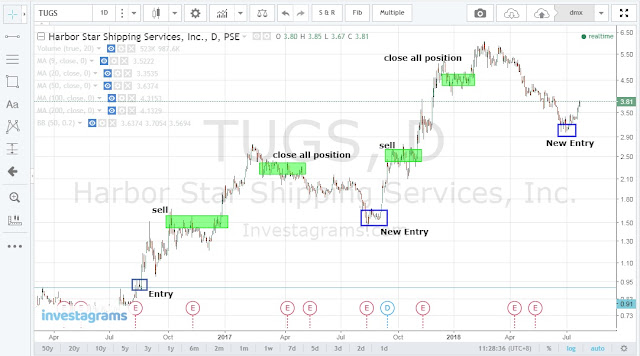
STOCK TUGS
Sample illustration to give you some idea, as long as price will advance just check with other indicators as well for sell signals and try to lock in your profits.
Disclaimer: Sample charts provided are for educational purposes only.
STOCK TUGS
Sample illustration to give you some idea, as long as price will advance just check with other indicators as well for sell signals and try to lock in your profits.
 |
| lock_in_profit_sample_only |
I had blown ₱42k profit because of too much greed and ended up selling with only ₱1.6k+ gains, rofl. With this failure I learned my lesson to protect my gains the next time I trade a particular stock.
Anything can happen even if you have the best set up prepared, do not try to dictate what the market will do, but let the market show you the info you need to execute your trades.
When it already showed you the trend do not hope and pray that the price will reverse to your favor, rather set your trail stops before it will take back the profits you earned when price was moving up.
Much has been said let me just show you how to apply some risk management via stop loss/trail stop, this is for educational purposes only and you may come up with your own style based from what will be presented.
It's up to you to come up with your own strategy out of this depending on your own "gut" feeling where you will be placing your own stop loss and trail stops.
Warning: Cut loss means loss of real money, if you are not psychologically prepared for it then practice with small amounts say ₱500-₱1000.
note: taken from Shoyu-ramen's style (this is just my own interpretation and understanding)
Stock: IRC
Buying Power: ₱10,000
No. of shares: 10,000
Entry price: ₱0.99 or ₱1.10
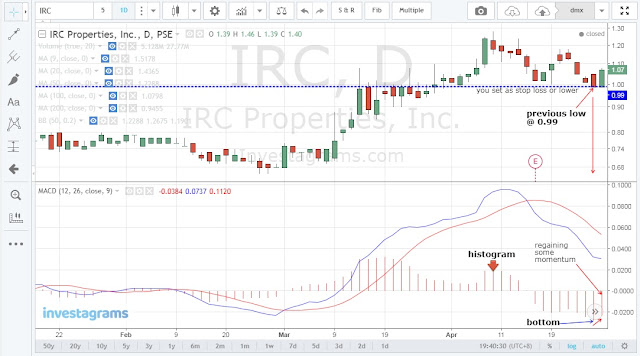
First you need to use MACD histogram and observe if it has established its bottom (below the 0 level), once the histogram starts to move up then you can use that bottom as your stop loss level or maybe lower .
 |
| macd_histogram_bottom |
Stop loss this is where you will be going to cut your losses and try to live another day, once your stop loss level is hit means you need to get out quickly and sell your shares right away.
From sample chart above the previous low remained at ₱0.99 then the following day you would notice the histogram already showed some sign of momentum which you can try to make your entry.
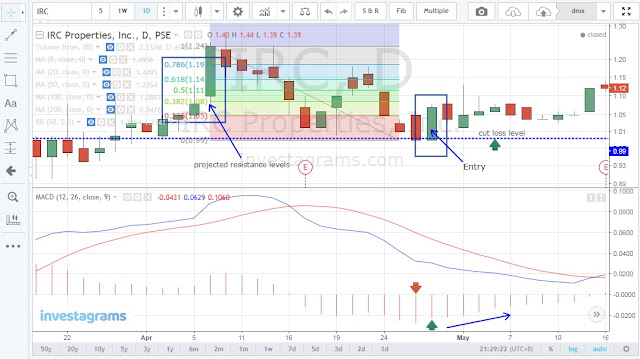
You may either choose to set your stop loss at ₱0.99 or ₱0.98 depending on your entry price if you entered ₱1.10 you may use ₱0.99, if you entered ₱0.99 you may set stop loss at ₱0.98 to ₱0.97 just an example (make sure to consider transaction fees).
Since our sample also opened same as our closing price on the previous trade then it's up to you if you will adjust your stop loss a little bit lower or make a very tight cut loss, so make the necessary adjustments.
If you manage to catch the opening price then the better and try to use some Fib retracement to pinpoint possible resistance levels where possible reversal can take place so you may know if you will hold your position or not.
 |
| check_for_resistance_levels |
Some traders will allocate 1% from their total amount of purchase and set that as their cut loss level like for example worth ₱20k of shares, amount they are willing to lose would be ₱200.
If you may also want to take a look from a different point of view from other traders by watching from here and watch along 17:23 and try to compare from another video here (around 3:35) and try to come up which one would you may adapt in your style.
Watch this video here for some additional learning.
 |
| risk_managment_from_boomie_trader |
 |
| ZF_risk_management |
To support boomie trader computation is well explained here in this video from Caylum.
 |
| Var_risk_management |
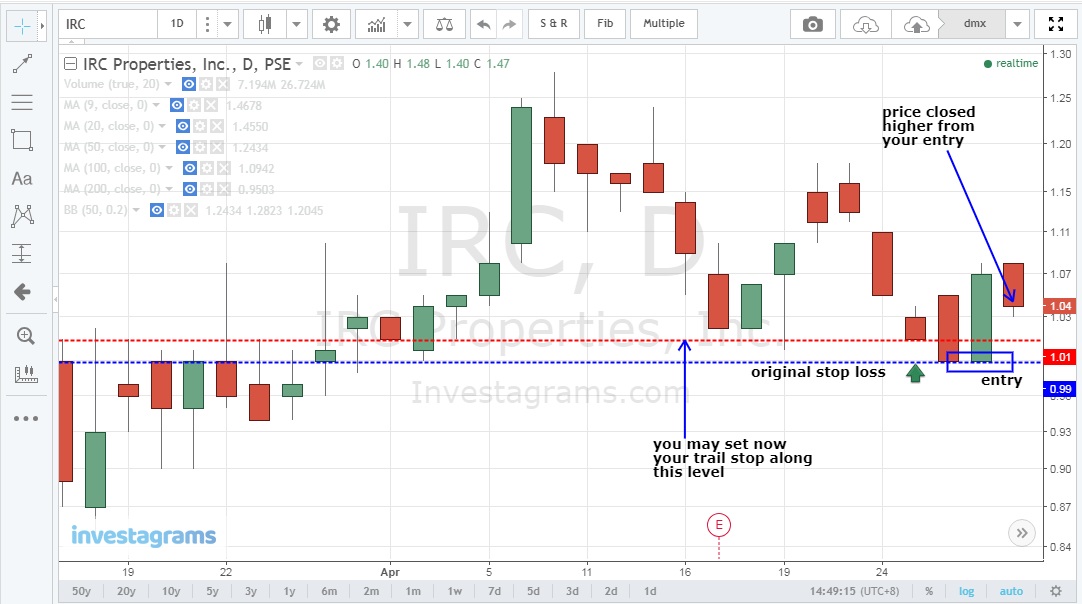
Say you don't want to use Fib retracement and just make some adjustments based on previous low to set your new trail stop then that would be possible as well. You are free to adjust to a level where you are comfortable with.
 |
| use_other_previous_low_to_be_your_trail_stop-chart_from_investagrams |
Above sample chart instead of using the term as "stop loss" now we call it as our trail stop (₱1.01) since once this level is hit we can still gain some amount from our 10k shares bought at ₱0.99/share
 |
| stock_calculator |
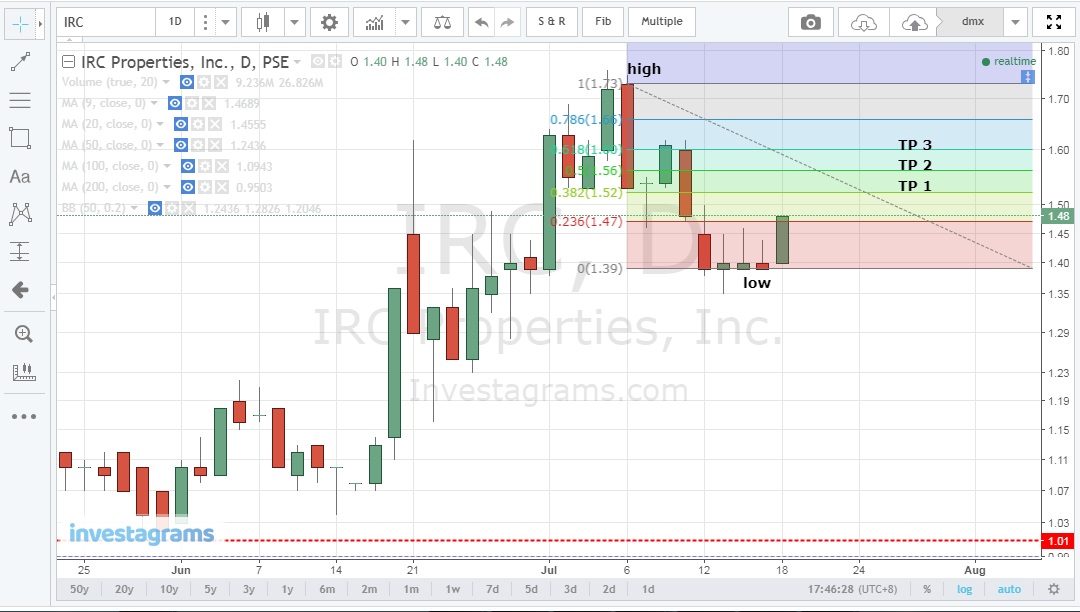
Just to continue using our Fib retracement we can definitely anticipate any support levels ahead.
 |
| breakout_and_support_levels_chart_from_investagrams |
As long as the price moves along your favor you may adjust your trail stop to protect your gains or lock in your profit and start selling portions of your shares to let your gains play the rest of the trade until a reversal takes place.
 |
| trail_stop_and_new_resistance_levels |
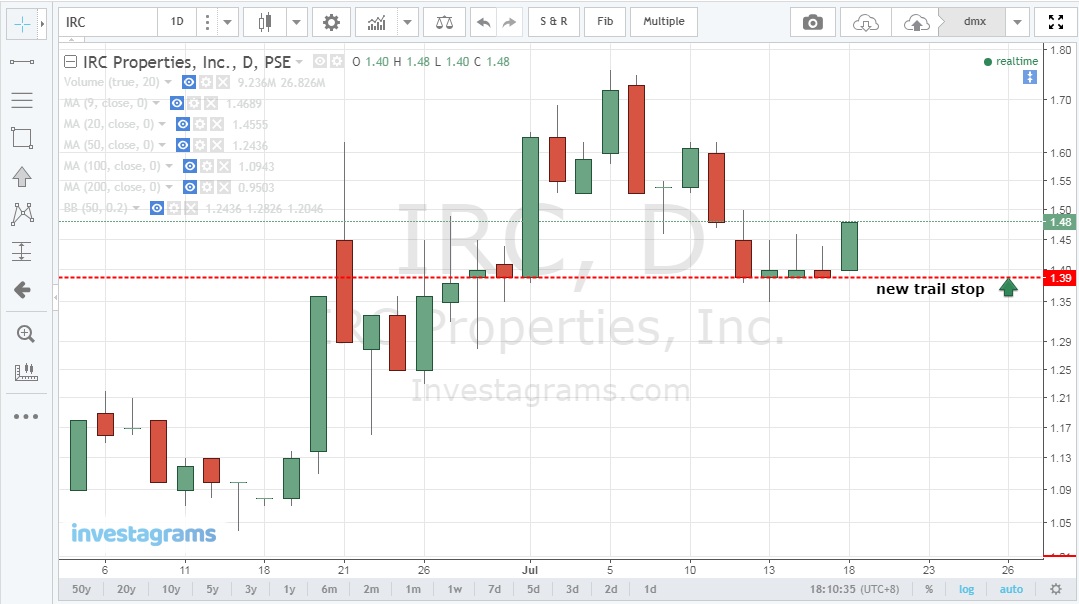
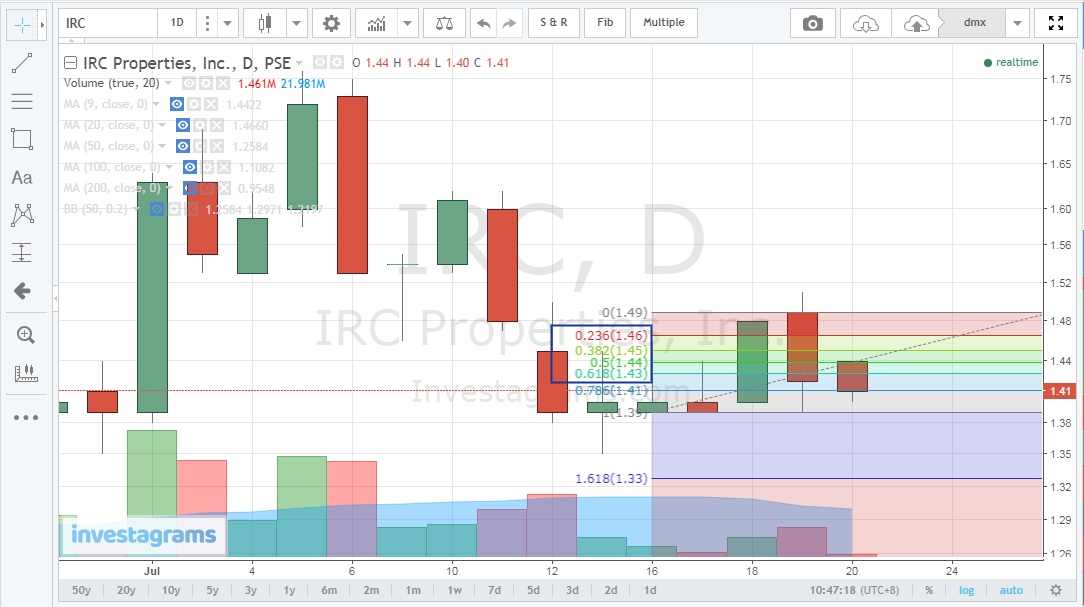
As of July 18, 2018 our resistance 1 already hit and managed to close above this level and we can now adjust for another set of resistance levels or target prices and we can already set the (1.39) as our new trail stop.
 |
| new_resistance_levels_or_target_prices |
 |
| new_trail_stop |
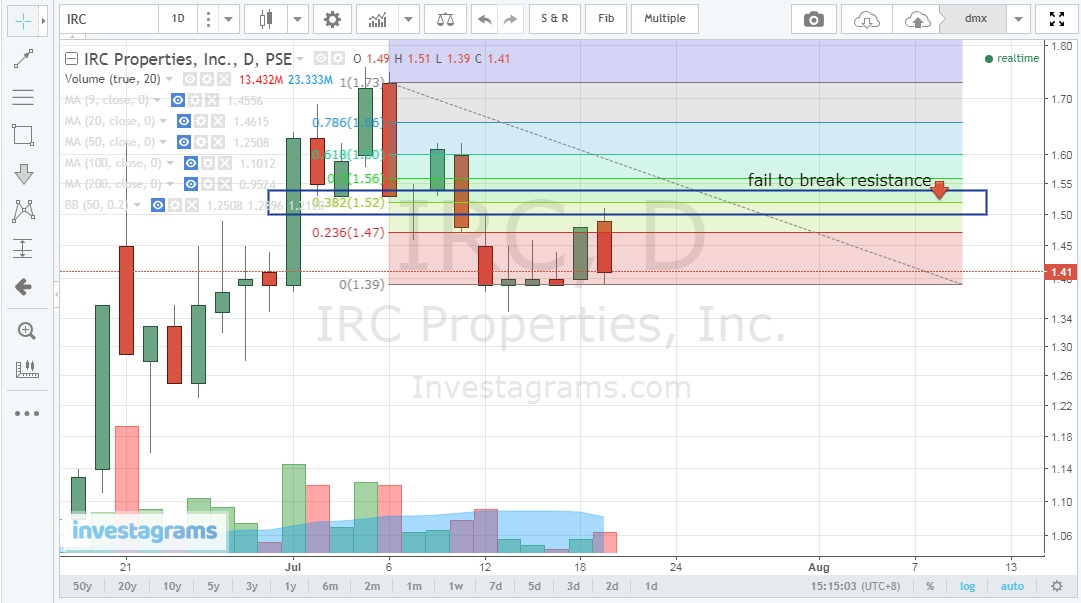
Failed to break our TP 1 (1.52) and came up short with 1.51 before sell down with volume greater than yesterday with your trail stop already hit.
 |
| failed_at_0.382_(1.52) |
So if you were holding IRC with a buy entry of ₱0.99-₱1.10/share then upon trail stop being hit would already be your signal to sell all shares or make some lock in profits, your choice.
 |
| support_levels |
As for the selling to this date July 20, 2018 having low volume might be an indication of selling pressure no longer as strong as of yesterday even it broke down from our support levels.
Stock: ISM
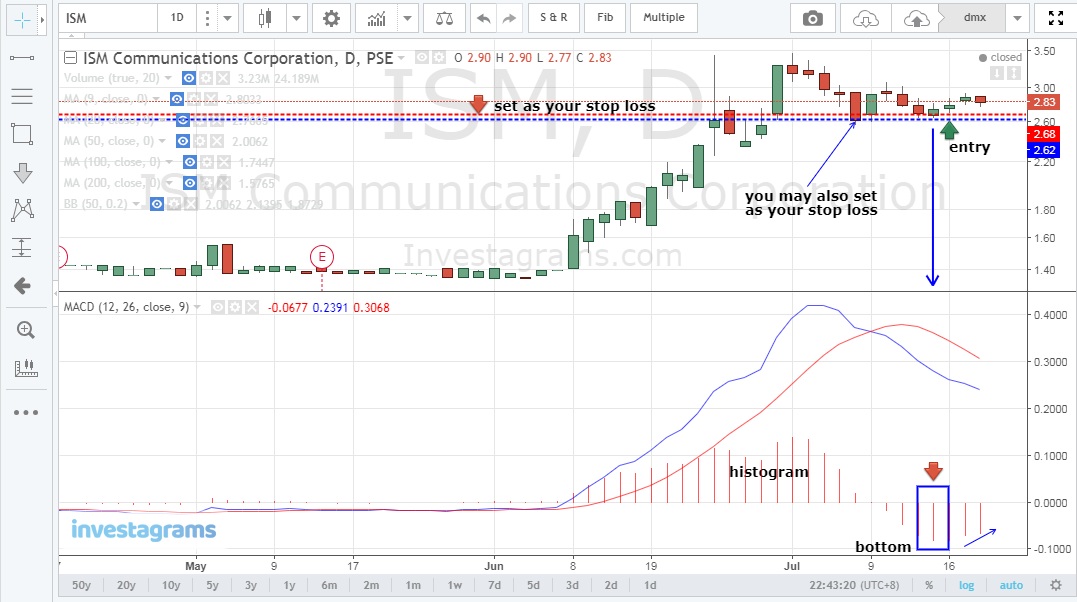
Looking for bottom "low" from histogram before making your entries and setting your stop loss levels.
Once a bottom was established and the following days you notice histogram making an advance upwards to the zero level then you can set that low as your stop loss but you may also look for other previous low if you are willing to risk higher.
 |
| stop_loss_levels_chart_from_investagrams |
These are sample illustrations only on how you will apply some risk management on your trades, it's up to you on how you will apply them if it suits you.
Just don't forget to confirm with other indicators like moving averages, bollinger, trend lines etc, and always check for the volume.
Try to practice every day from charts and observe your forecasts with the market on how it goes. Just always remember its your money and you must know how to protect your own investment.
Never stop from learning...
Here's an excel file for Var Computation that you can download.
If you find this helpful, say thanks by sharing this site!


0 Comments