 Price is king as some traders would say, which means you can actually make your trades by merely looking at previous price actions without the use of indicators like your moving average, rsi etc.
You don't need to analyze too much because at the end of the day the outcome will be decided by the market.
Keep it simple, less clutter will be easier for you to execute than too much decorations that will only affect your decision when the market starts.
There are only three major movements that go in a cycle UP, DOWN or Sideways, its a matter of how you will be able to position yourself ahead and take advantage before a reversal will about to happen.
Let's look at some price actions of some stocks.
Disclaimer: Sample charts provided are for educational purposes only.
STOCK: MPI
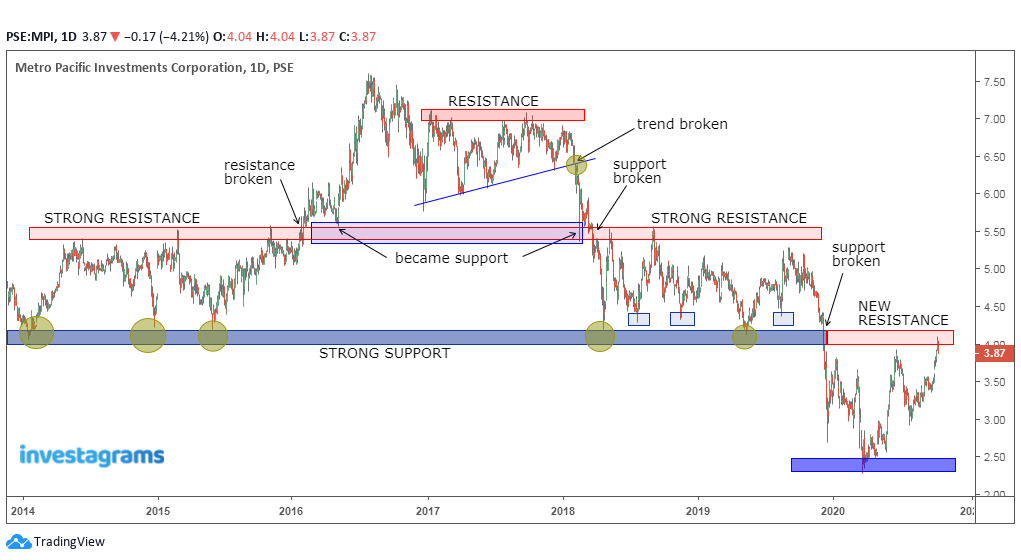
➤looking at previous strong support and resistance levels one can easily get an understanding how the market reacted to these levels.
➤notice how the previous support turned resistance and at the current market price is trying to break out from this level.
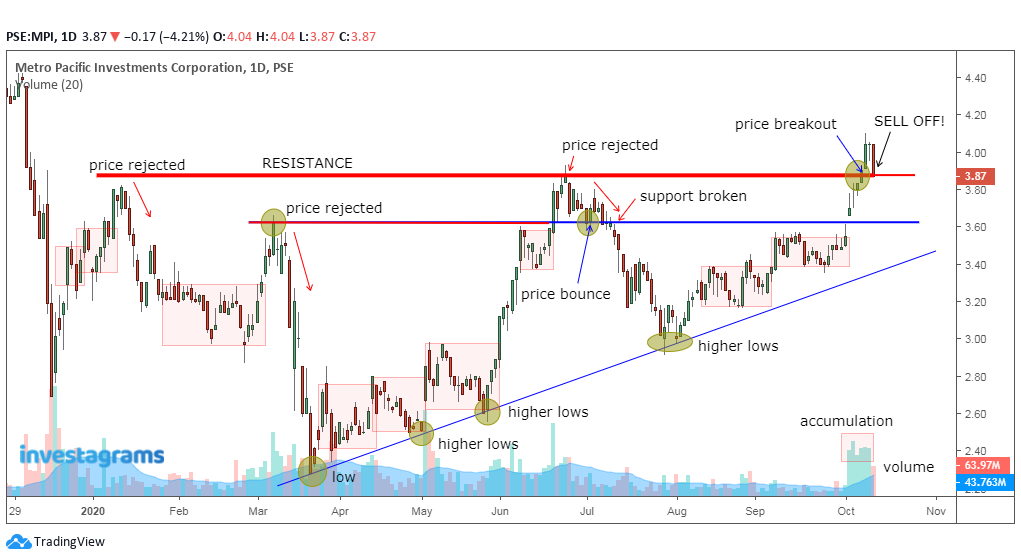
➤let's get a closer look where price got rejected and how it formed its higher lows and made a breakout but was countered with a sell off.
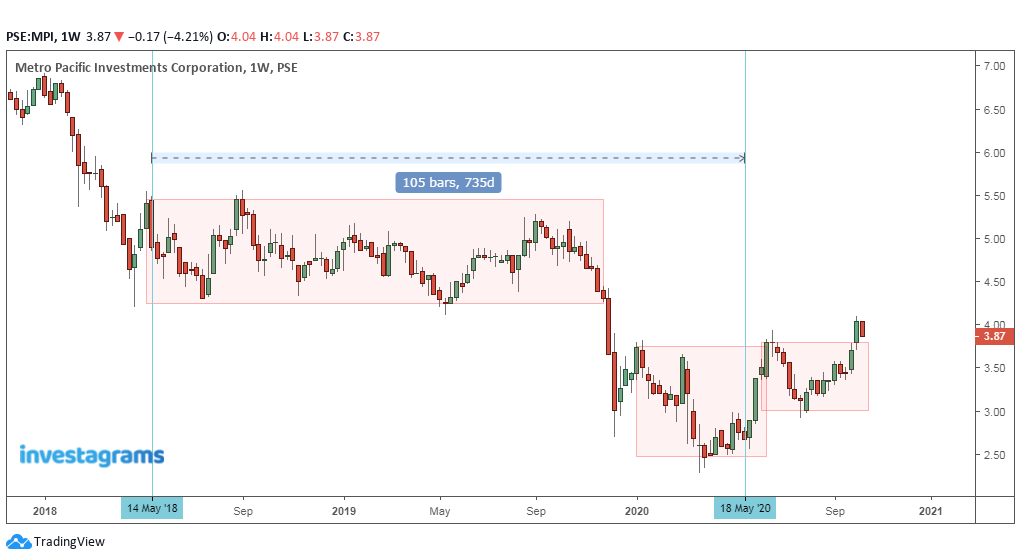
➤looking at its weekly on how boring this stock is (lols), for almost two years trading in sideways, well let's watch if it can break ₱4.00-4.25 area as a tough to beat resistance.
 |
| chart_from_investagrams_MPI |
close look...
 |
| chart_from_investagrams |
weekly time frame...
 |
| chart_from_investagrams_MPI |
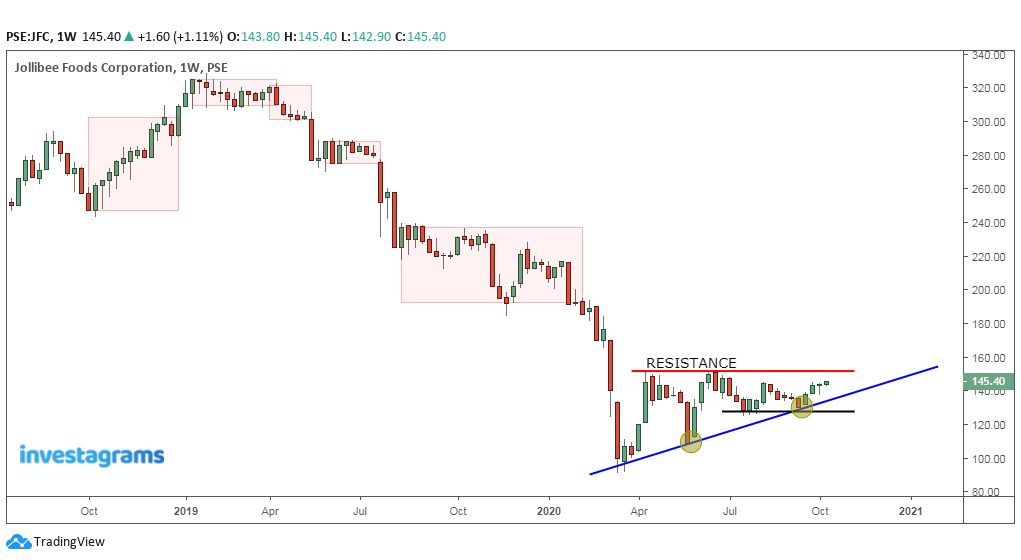
STOCK: JFC
➤let's take a peak on its weekly, by glance we know there is a resistance waiting along 150 area just between the current price of 145 to 160.
➤if price rejected along that line then let's watch if it bounce along 135 to 140 levels.
➤look how higher lows are also formed and a support holding along 125 to 128 for the past weeks.
➤weekly charts still need to pass two resistance levels from 6.50 to 7.00 area with supports holding along 5.00-5.50
➤great volume of buyers for the past two weeks, with low volume of sellers kicked off on the 3rd week of October, let's see if it will trade sideways till the end of October.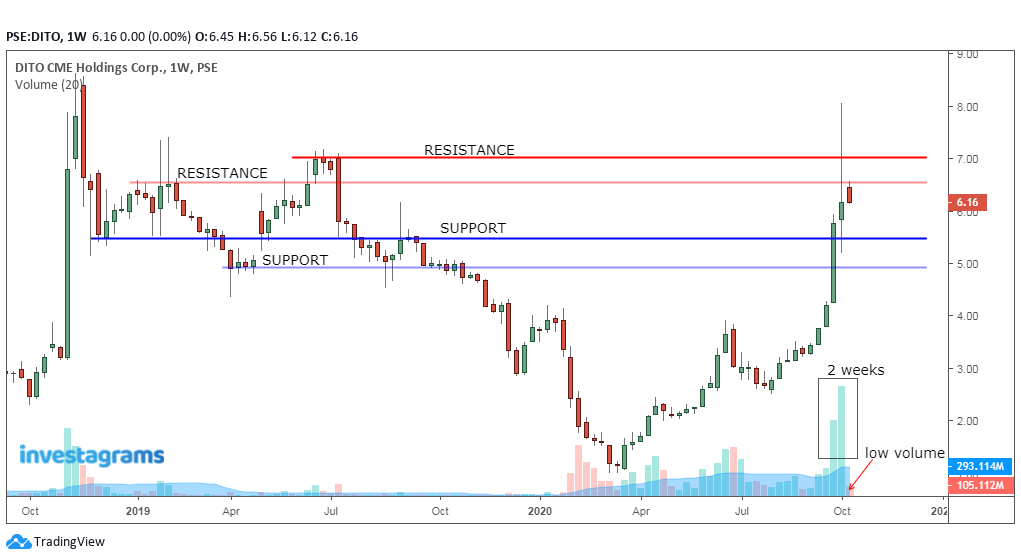 |
| chart_from_investagrams |
You may add up using candlestick patterns if you wish like doji, bullish engulfing, three white soldiers, harami cross etc. but don't expect these patterns to work all the time, the market is always right.
Just watch out on previous major support and resistance from a daily or weekly time frame so you have idea on where to pick up and let go.
Hope you can find your edge with the simple use of price actions.



2 Comments
THANKS A LOT FOR THIS INFO. GODBLESS YOU SIR
ReplyDeleteyour welcome hope it helps :)
Delete