If you happen to read about learning on how to escape the bull trap that I wrote then perhaps this will be no longer hard for you to play the bear market.
The principle you apply in managing your funds to escape the trap will also apply in a market where price is going down.
Remember even on a bear market will still have some short rallies and can still make some profits plus this is the best time to practice to get rid of your emotions when trading.
Disclaimer: Sample charts provided are for educational purposes only.
STOCK: JFC
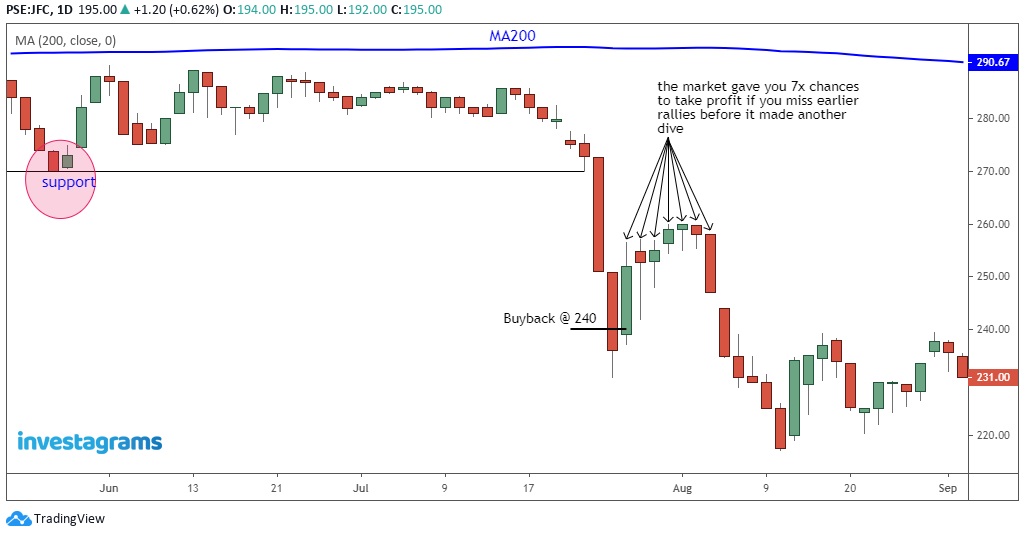
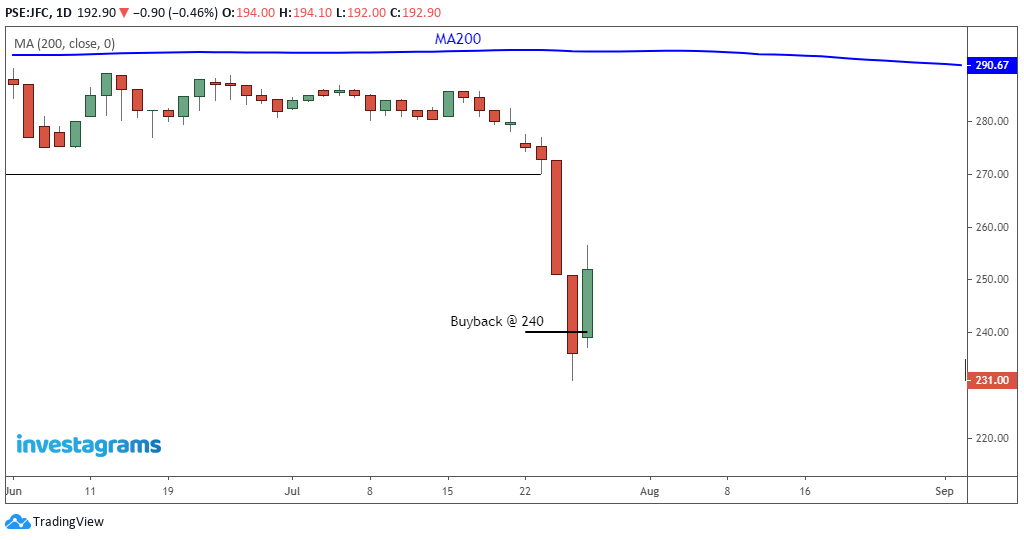
➤now let's say the MA200 is already above your prices which is already a sign that a stock is most likely going for a dive.
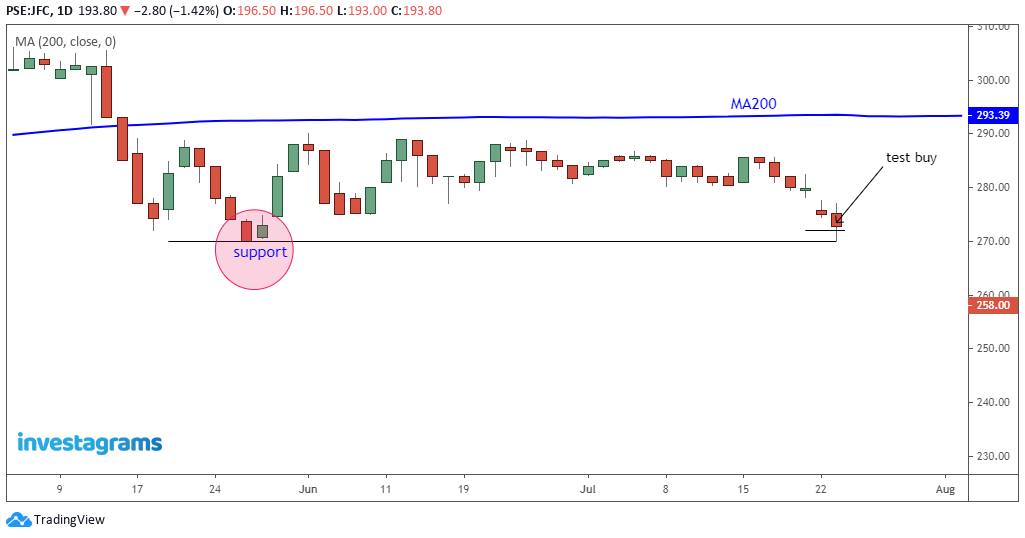
➤yet on daily price action even with that condition you spotted that the stock is consolidating with a support along 270 area which you decided to test the waters along 272 just above that support.
➤as trader you should already imparted on adding risk management on your trades else you will end up beaten by the market.
1. Consolidation
Trade Plan
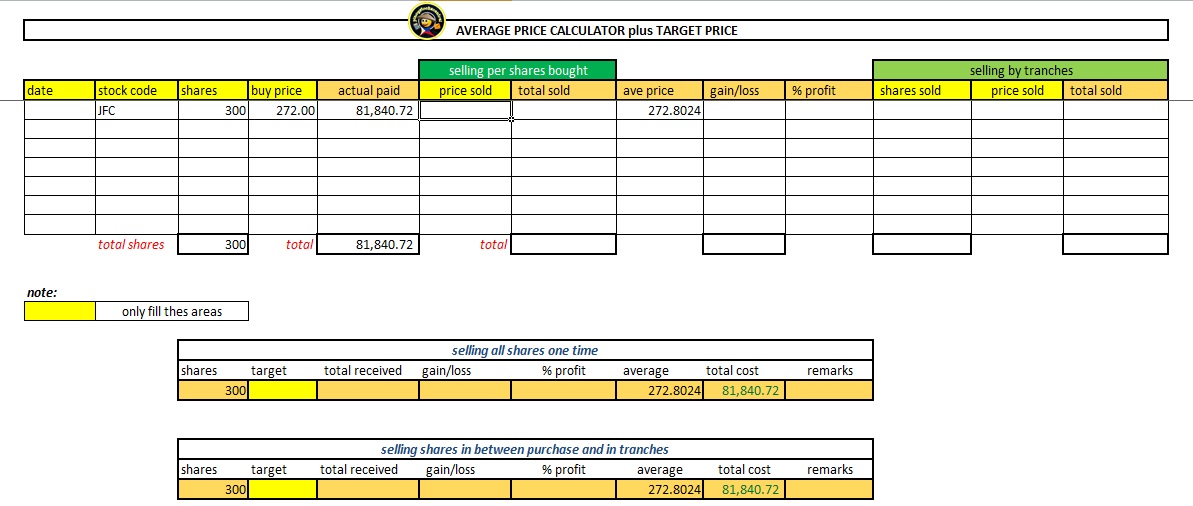
entry: 272
exit: 270
shares: 300
 |
| chart_from_investagrams |
With our calculator to monitor our progress in our trade
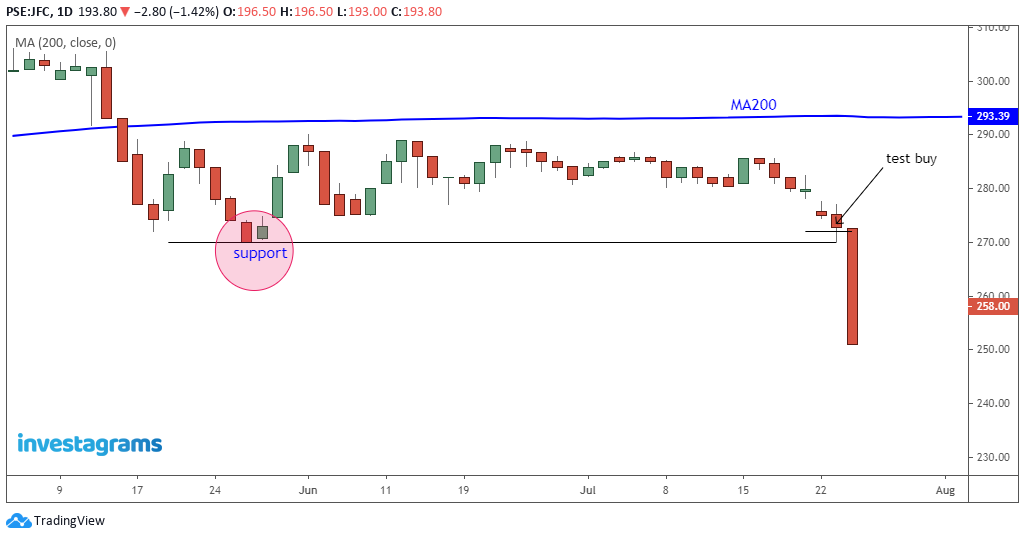
2. The next day all of a sudden this happened...SELL OFF!
➤your support at 270 is already broken.
➤good thing you have a plan to exit along 270 if not? you just voluntarily imprisoned yourself this time around it's a Bear Trap!
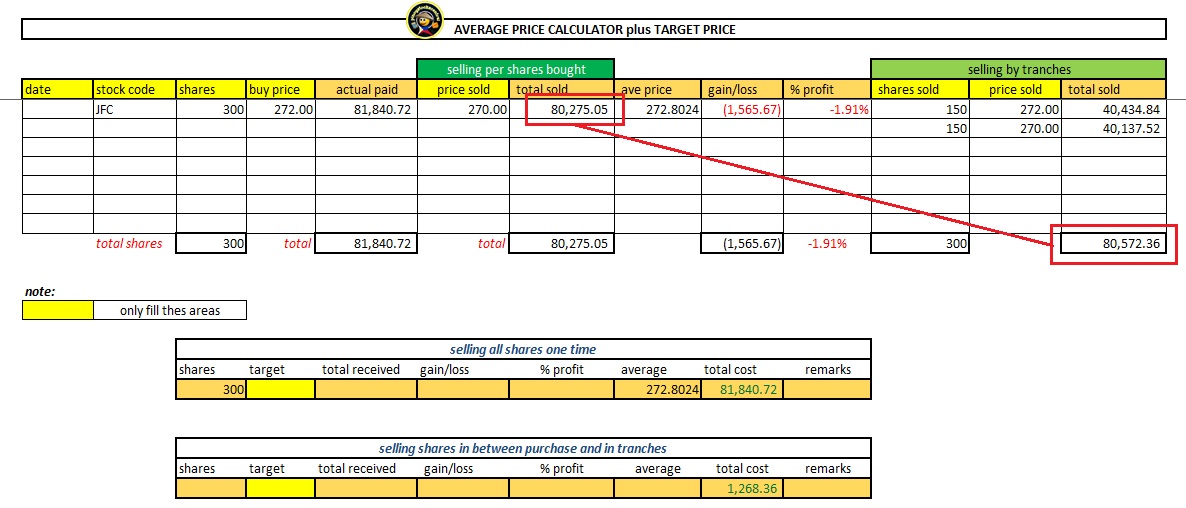
Try to digest this, if you want to be a pro trader actually you don't need to sell along 270, but upon purchase you can actually sell half of your position already with the same price of 272 making you a winner (psychologically).
The other half will be on hold if ever the price will go up and we can easily dispose, if not then we can go with the original plan to sell along 270 if the price keeps diving.
 |
| chart_from_investagrams |
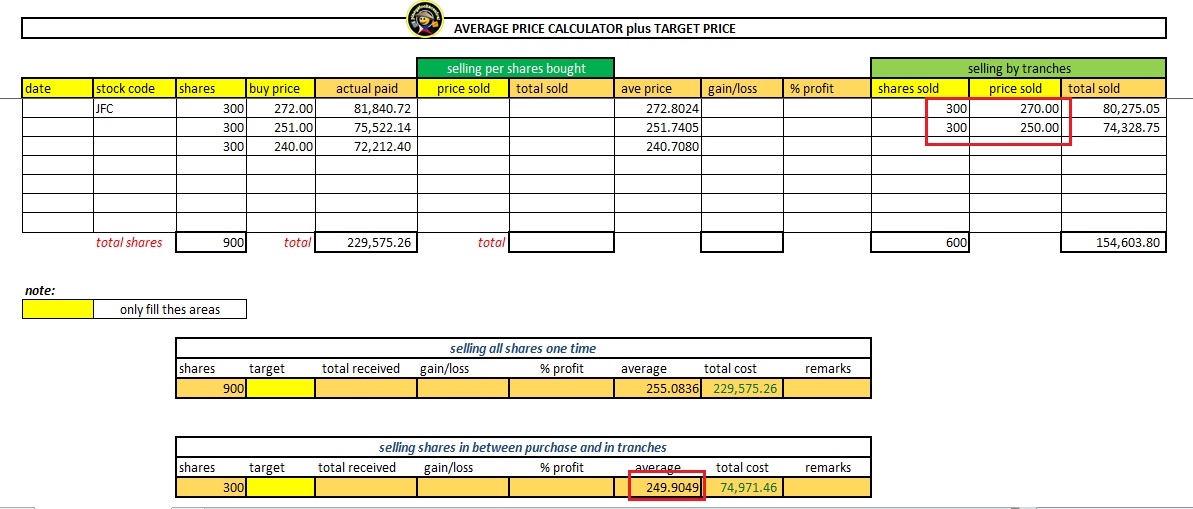
Here's a comparison on selling in tranches than selling one time as you can see the difference on how much cash returned.
➤selling half immediately upon purchase with the same entry price or if the market gives you a chance higher from your entry then the better, since it's a trade on a bear market then chances are slim.
➤after selling your shares either selling one time (cash returned 80,275.05) or from selling in tranches (cash returned 80,572.36) will be already a new set of buy power you have absorbing some small amount of loss from the sell off.
Question:
Will you buyback right away during the sell off?
Answer:
Yes and No
Yes, but apply the same principle above upon purchase sell immediately the other half (for buyback).
No, wait for the next candle until support is made with some signs of buying pressure.
3. Moving forward with the next candle after the sell off...
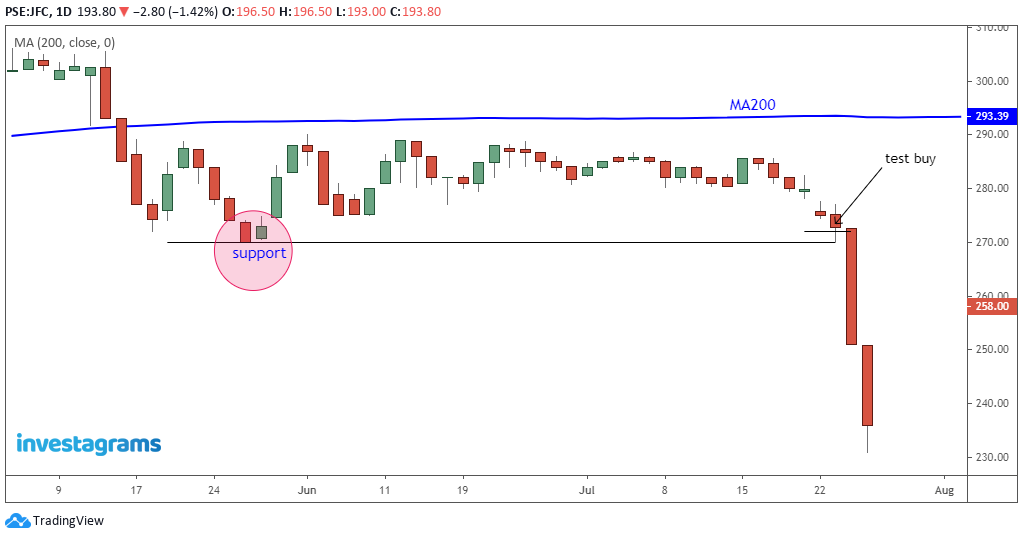
➤so if you are impatient to buyback during the 1st sell off and did not wait for the next candle yet this happened then there's no need to get emotionally stressed.
➤you're trading the Bear market so expect these things to happen.
 |
| chart_from_investagrams |
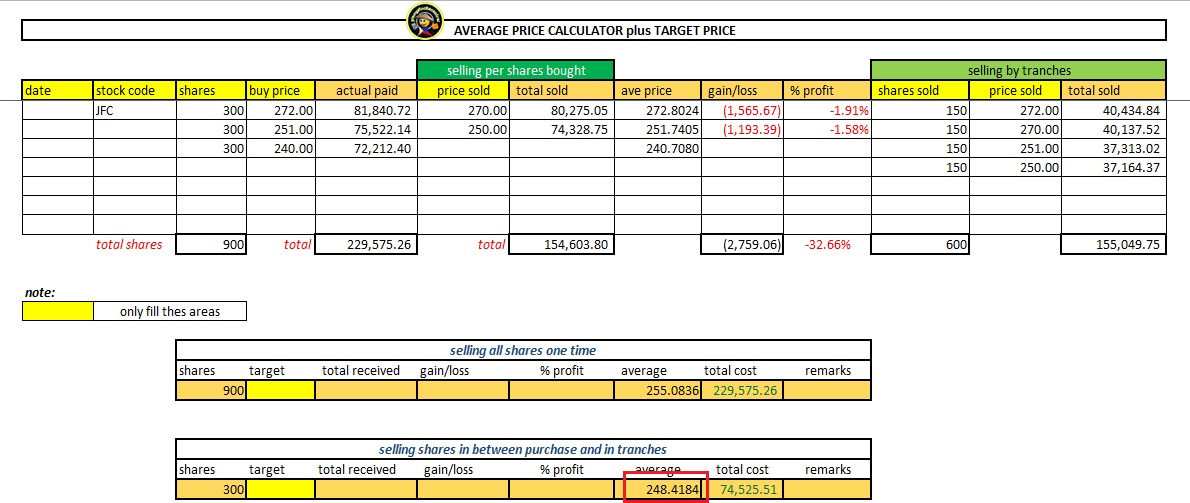
Let's go back to our calculator
➤say you bought the same number of shares of 300 along 251 (total cost 75,522.14) then so far from 80,275.05 or 80,572.36 (depending on how you sold your 1st purchase earlier) will still have an excess of 4,752.91 and 5,050.22 respectively as your discount or can be already your profit less your earlier minimal losses would still be a profit (IF PRICE starts to move up)
➤but in this case there was continuous selling as shown from above chart so you need to do the same process of selling half or if you're more comfortable selling one time won't matter to get a new fresh of buy power.
A new set of buy power with same principle you did on your first purchase
 |
| chart_from_investagrams |
You'll get back 74,328.75 or 74,477.39 respectively depending on your own comfort of selling
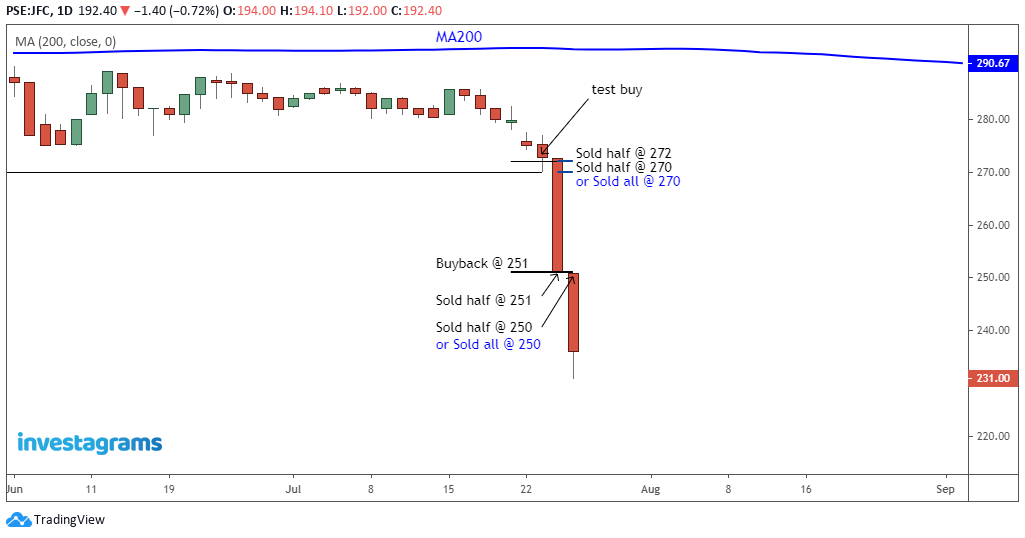
➤by luck you get to see some shadow or tail from this candle which means some are trying to push the price up or interested buyers are trying to come in.
➤watch out for the next candle if price opens higher from previous close and you can start to make your buyback.
➤we won't make a buyback at this candle as we won't suffer the same fate when we rushed during the 1st sell off.
3. The 2nd Candle after the SELL OFF
➤add some patience for your re-entry as the market will give you such an opportunity.
➤since the following candle indeed opened higher from its previous close (236) then you can target 237 and above.
➤say we just buyback at 240 with the same number of shares with the cash we had from selling from our 1st buyback that failed then would still give you excess and considered a profit if price goes up.
➤from given chart below price went up as high as 256.60, and if you were able to catch along 240 and sold at least along 256 then you already made a profit inclusive of your previous losses.
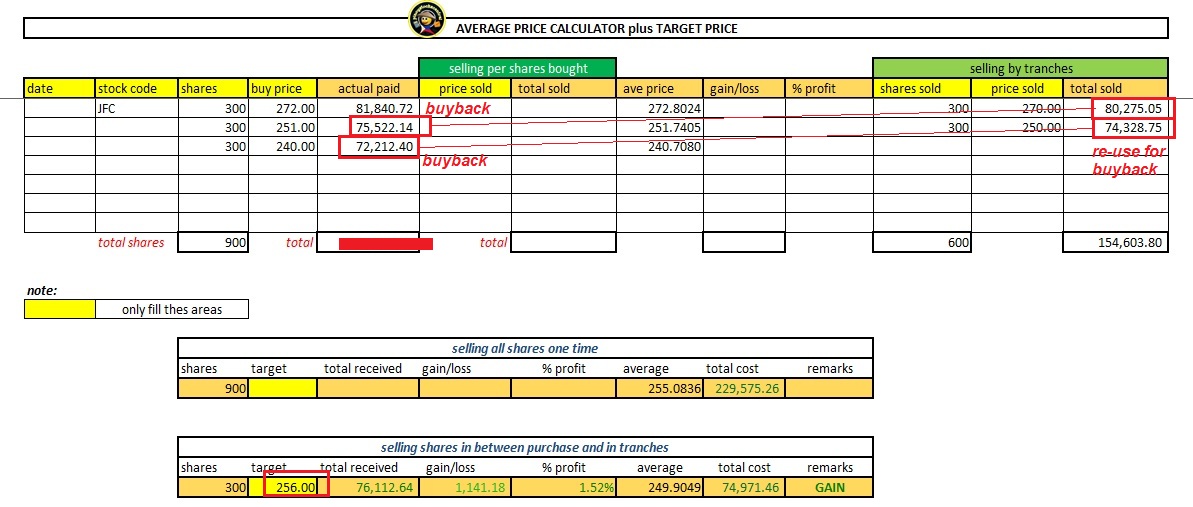
a. Here's your current average (if you sold one time and do your buyback) average @249.90
b. Here's your current average (if you sold in tranches and do your buyback) average @248.42
Lots of opportunities the market has given which you should already grab since you are playing the Bear market
 |
| chart_from_investagrams |
Sample profit when you sold at 256
Here's a short summary:
buy: purchase of 300 @ 272 = ₱81,840.72 (original cash used)
sell: sold 300 @ 270 = ₱80,275.05 (cash returned #1)
loss: ₱1,565.67
1st buyback: 300 @ 251 = ₱75,522.14 (from ₱80,275.05 re-use, excess of ₱4,752.91)
sell: 300 @ 250 = ₱74,328.75 (cash returned #2)
loss: ₱1,193.39
2nd buyback: 300 @ 240 = ₱72,212.40 (from ₱74,328.75 re-use, excess of ₱2,116.35)
sell: 300 @ 256 = ₱76,112.64 (cash returned #3)
sum latest cash returned (#3) with excess from buybacks
=₱76,112.64 (cash returned #3) + ₱4,752.91 (excess) + ₱2,116.35 (excess)
=₱82,981.90 cash at hand
profit computation will be cash at hand less original cash used
=₱82,981.90 - ₱81,840.72
=₱1,141.18 same result from our calculator above :)
or
=₱76,112.64 - (₱81,840.72 - ₱80,275.05 + ₱75,522.14 - ₱74,328.75 + 72,212.40)
=₱1,141.18 profit
Hope you were able to follow as the main idea on why you sell your shares if the price drops is to secure a new fresh buying power to buyback on levels where it created some support.
If you find this helpful, share this with your friends! Happy trading!





0 Comments