Before I proceed, welcome to the Bear market as of this writing. Don't worry too much as you are not alone.
If you are an art lover then regardless of what the market maybe either in a bull or bear trend you should be able to entertain yourself how the market can create a beautiful pattern for your eye's satisfaction.
Setting aside how much you may profit/loss somehow the market does not fail to mesmerize us with such beauty it can create.
Truly I may say that trading is a masterpiece, if you have already heard about guppy multiple moving averages then it's about time to know that rainbows are not only formed from the skies but in the market as well.
Again it's no rocket science that you can not get what the market is telling you when you see these moving averages arranged in such manner just like your AOTS formation.
Total of twelve moving averages that consists of two groups, one is for the moving averages for the short term period time frame and the second group for the long term period time frame.
Short term
3, 5, 8, 10, 12, or 15
Long term
30, 35, 40, 45, 50, or 60
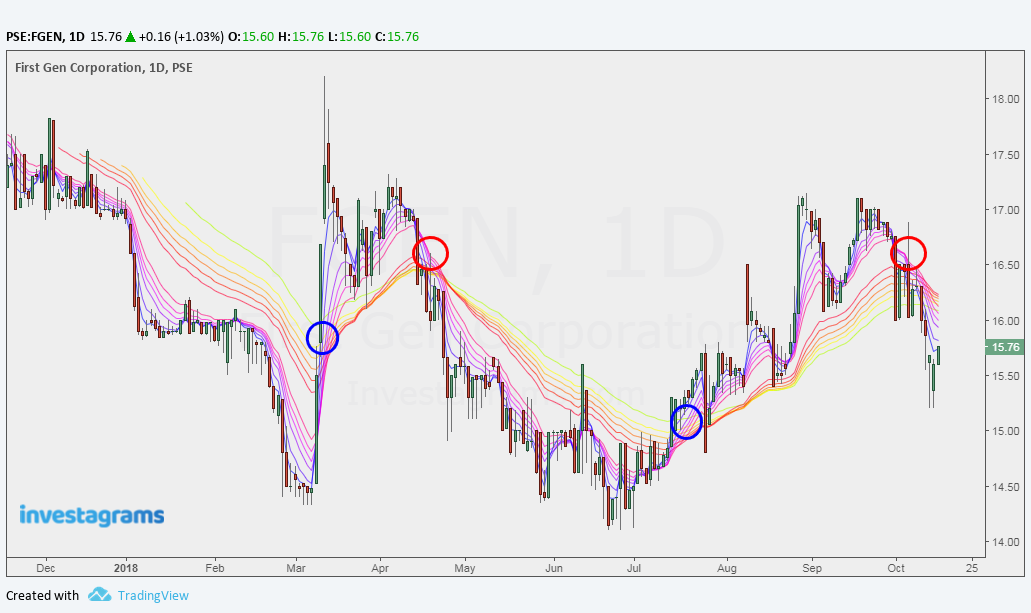
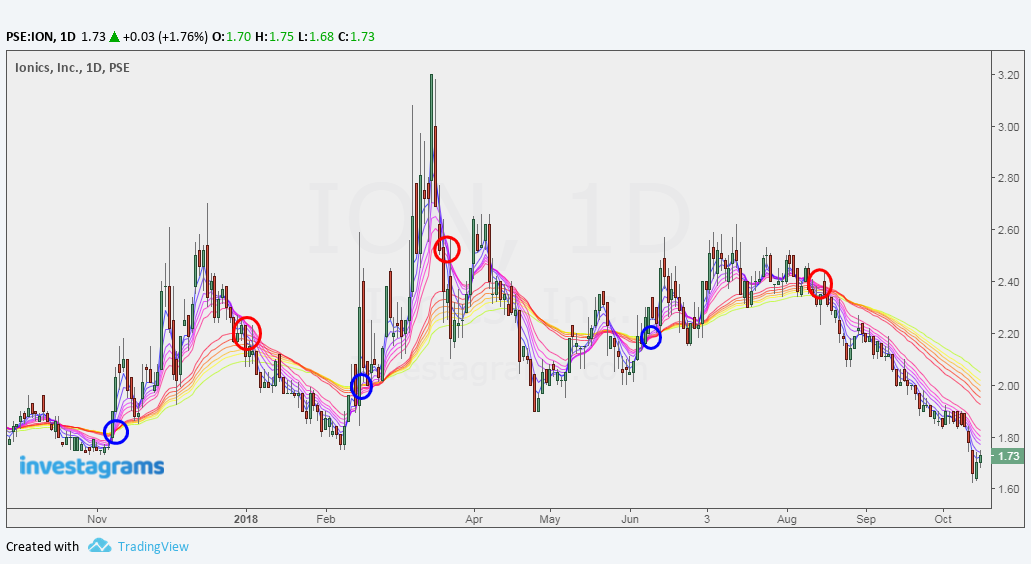
If the short term group position above your long term group would signal that the market is flowing along a bull market and vice versa would tell you a bear market.
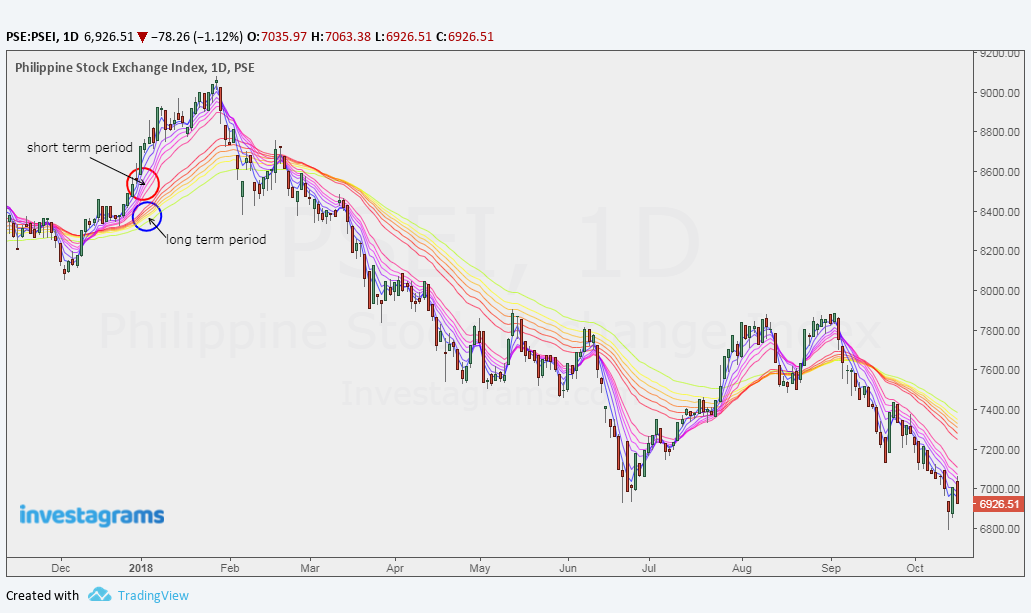 |
| PSEI guppy multiple moving averages_(chart from investagrams) |
Not too complicated to understand as you can already digest the current trend, it's a matter of trying to position when the market will signal you a perfect alignment of the two groups where short term>long term.
Disclaimer: Sample charts provided are for educational purposes only.
Here are sample stocks for you to appreciate its beauty and at the same time knowing if it's already perfect to enter into a position or sell your position.
STOCK: FGEN
STOCK: ION
STOCK: IRC
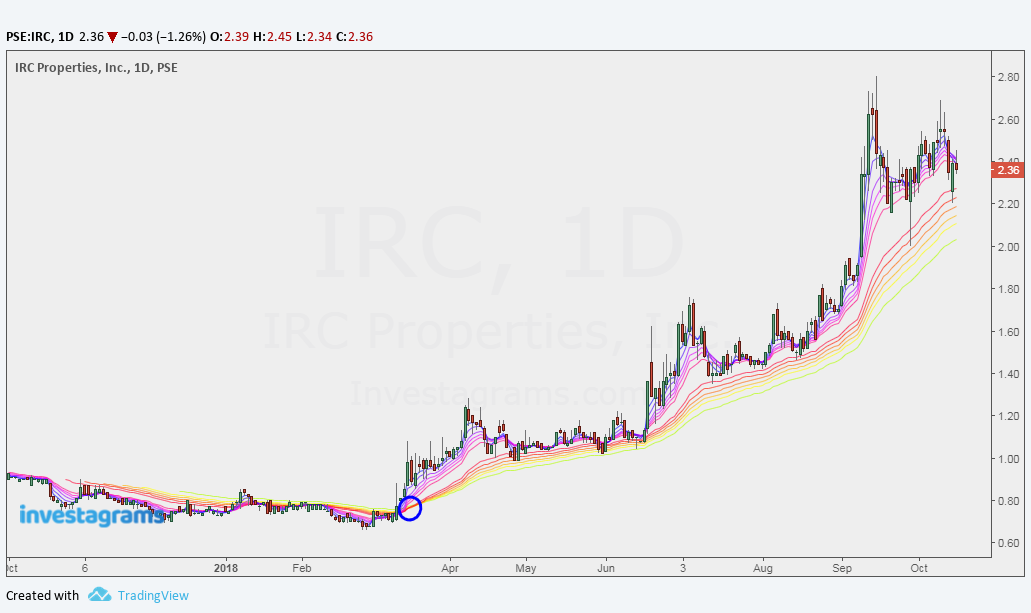 |
| IRC guppy multiple moving averages_(chart from investagrams) |
STOCK: ISM
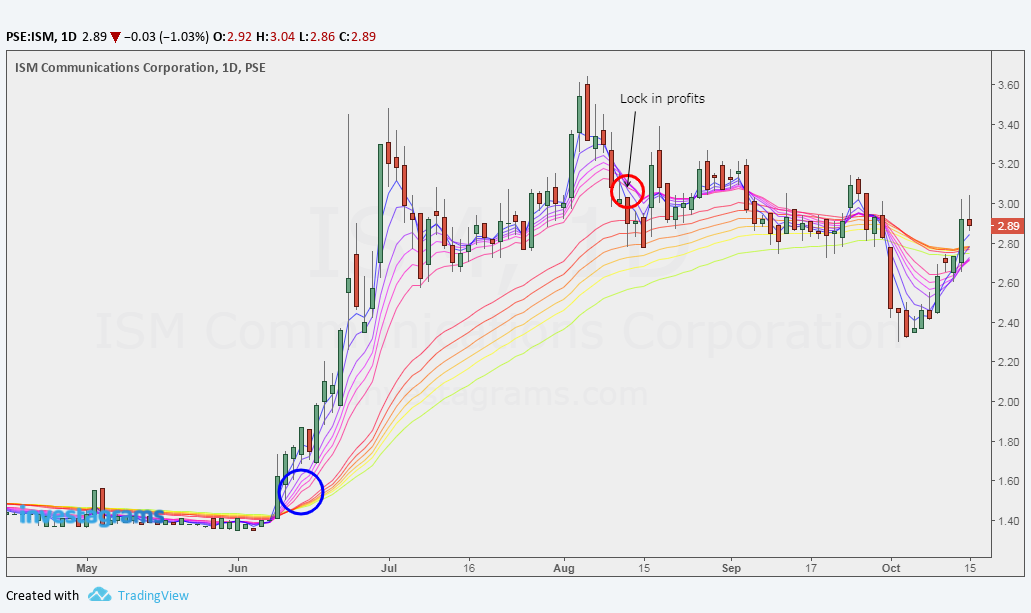 |
| ISM guppy multiple moving averages_(chart from investagrams) |
Here are some Stock exercise for you to train yourself to determine your probable entry and exits.
STOCK: MPI
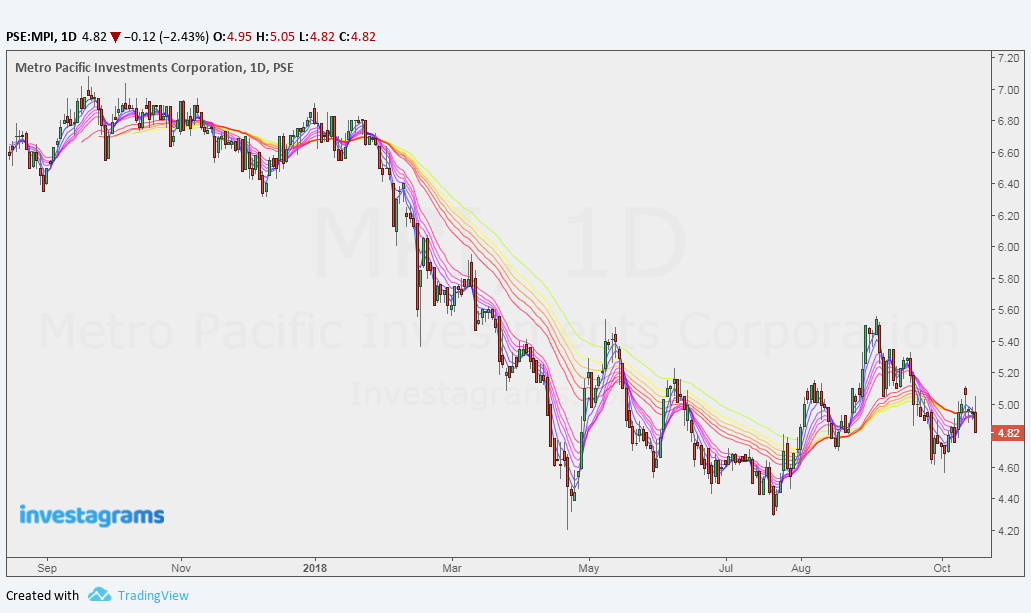 |
| MPI guppy multiple moving averages_(chart from investagrams) |
STOCK: MRC
 |
| MRC guppy multiple moving averages_(chart from investagrams) |
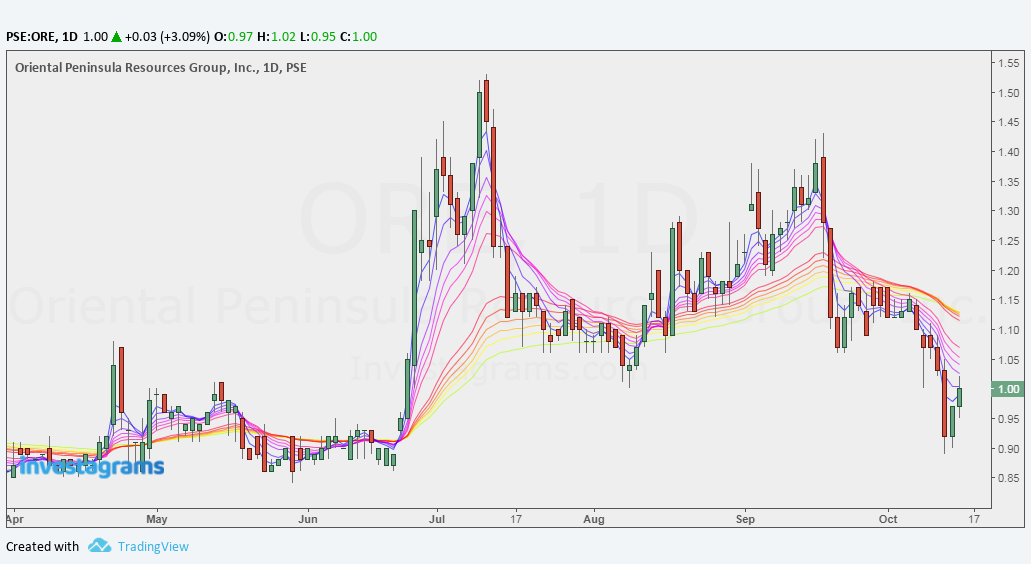
STOCK: ORE
 |
| ORE guppy multiple moving averages_(chart from investagrams) |
STOCK: POPI
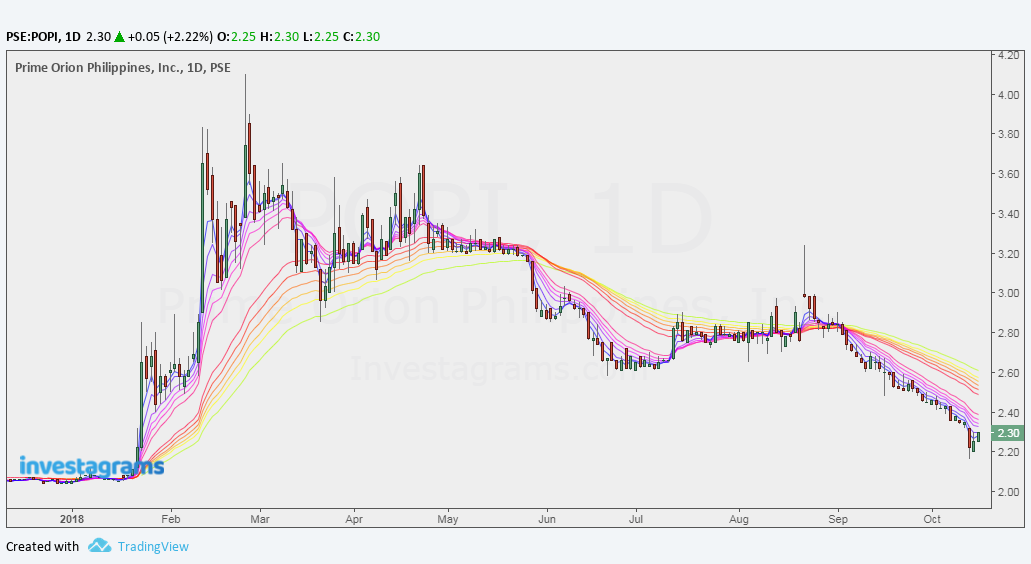 |
| POPI guppy multiple moving averages_(chart from investagrams) |
STOCK: TBGI
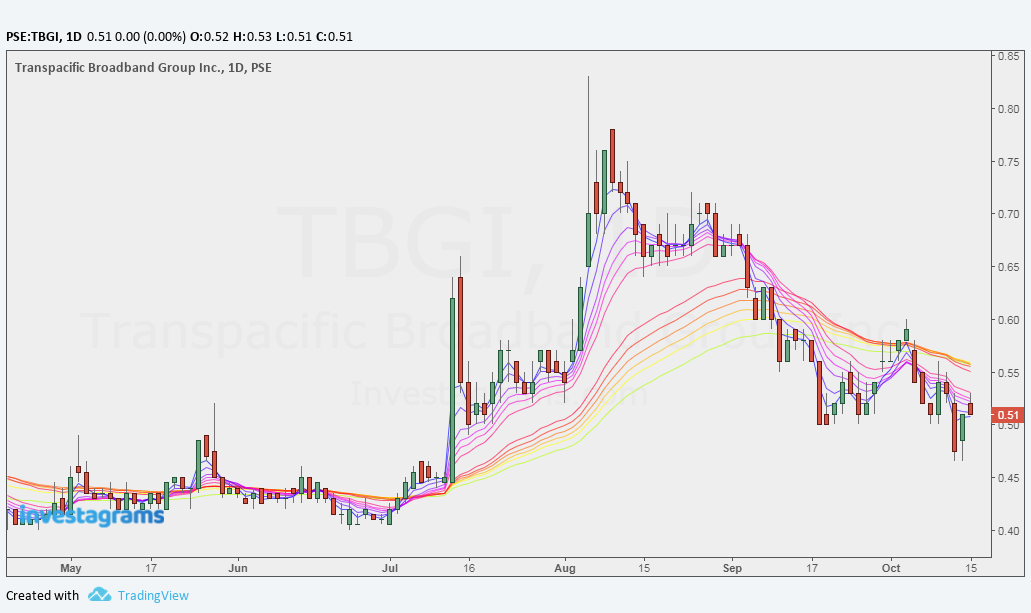 |
| TBGI guppy multiple moving averages_(chart from investagrams) |
STOCK: TUGS
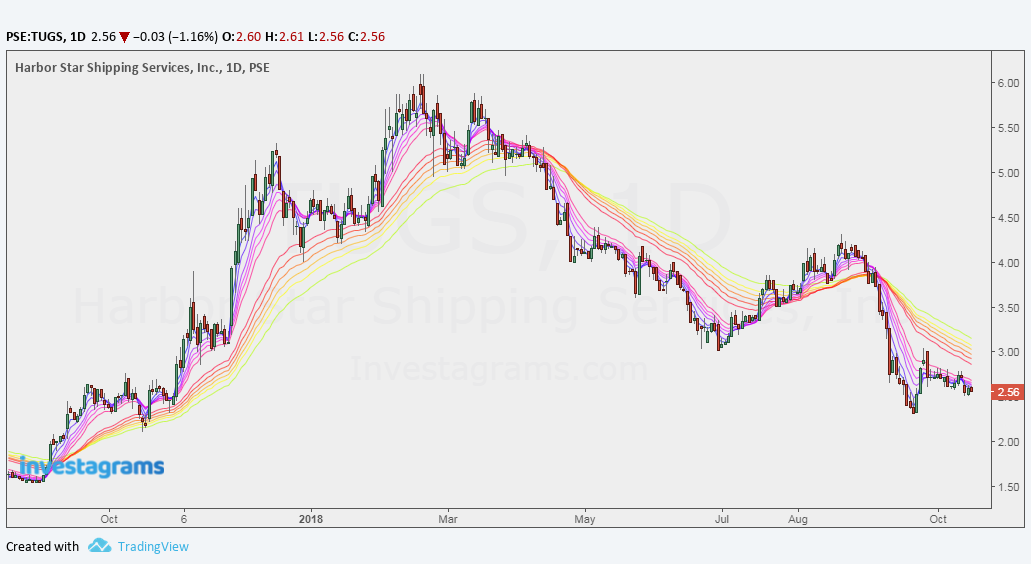 |
| TUGS guppy multiple moving averages_(chart from investagrams) |
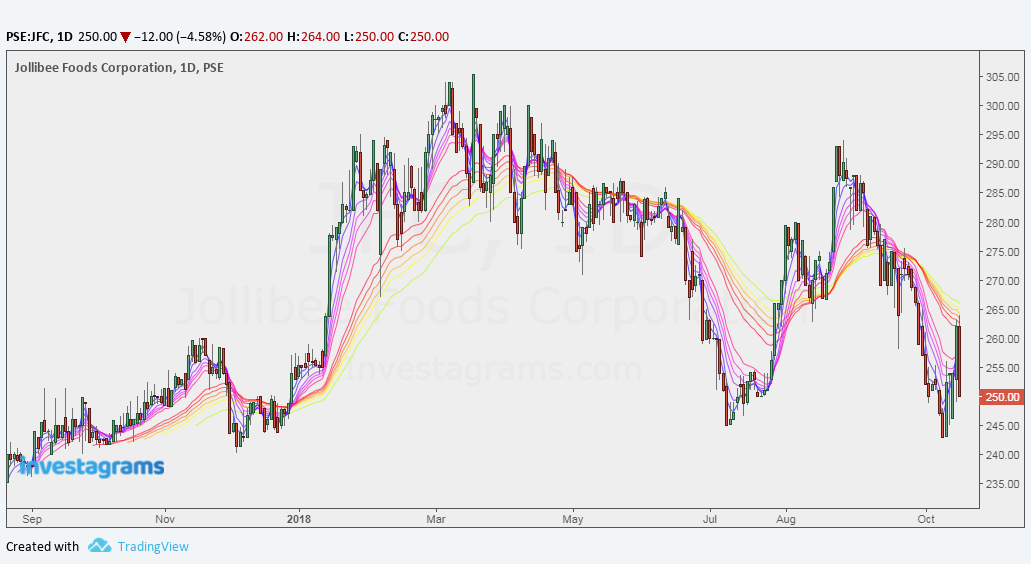
STOCK: JFC
 | |
|
You may experiment and use other time frames as well as presented above are on "daily" time frame plus instead of the usual simple moving averages used, above samples are exponential moving averages.
The wider the gap between the short group and long group signifies stronger momentum either for the bull or bear while the moment they get entangled on a horizontal movement is simply on sideways.
Don't forget to combine this with your own risk management strategies and know where you will cut your losses in case things fail as this analysis does not exactly tells how each and individual traders or investors will react on the next trading day.
This is just one way to get an edge in your trades but how you manage your funds is more important to survive the volatility of the market.
Check out my other posts to get an idea how the market is played and how to get rid of your emotions under Studies.
If you find this helpful, say thanks by sharing this site!



0 Comments