Another way to make money from the market aside from buying on breakouts is simply accumulating some shares before a breakout may happen.
This is the time when the stock is in consolidation where no big moves happening with low volume and with small bodies of the candles being formed.
Take note that this may take some time from weeks to months "kaya dapat hindi ka mainipin kumita agad ng pera".
"Money is made by sitting"-Jesse
Disclaimer: Sample charts provided are for educational purposes only.
STOCK: ACEN
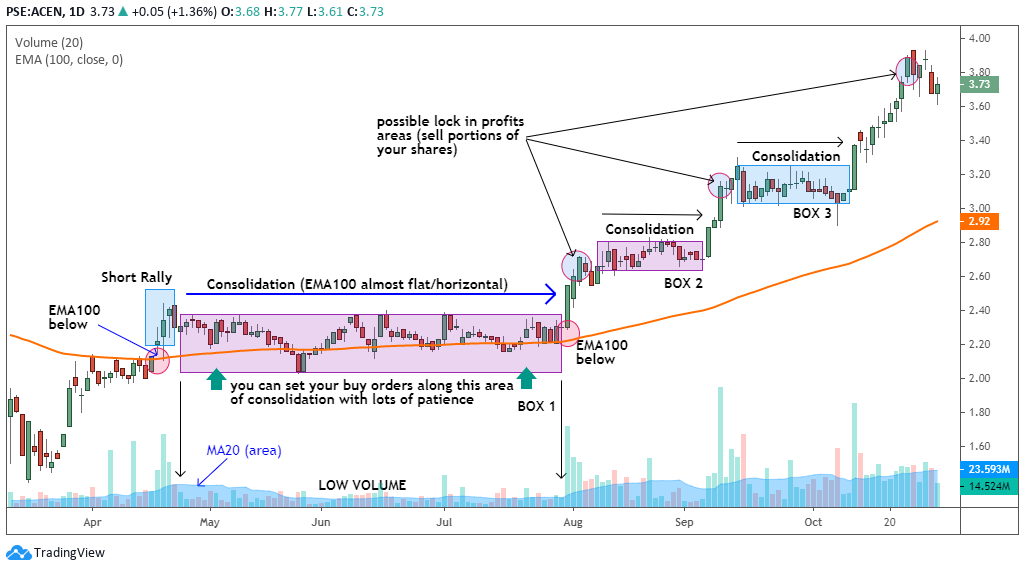
➤try to spot a simple or exponential moving average (100 days) if it is about to position below your prices (coming from a downtrend) and almost dead flat on your charts then start to buy in tranches (test buy).
➤observe also the volume if it is below your MA20 area
➤if you notice how short the bodies of the candles are formed then that's an advantage
➤when breakout occurs (with huge volume) make it a habit to take profit either the next candle after the breakout or succeeding candle (2nd or 3rd candle) or use a moving average (5 days) as your trigger to sell portions of your shares
 |
| chart_from_investagrams_ACEN |
➤almost 5 attempts from EMA100 before a full breakout succeeded with that huge volume as the 1st attempt only made a short rally which became the basis of a previous high (resistance).
➤total of 3 boxes of consolidation if you were able to spot this stock and pick from these areas then that would fatten your equity.
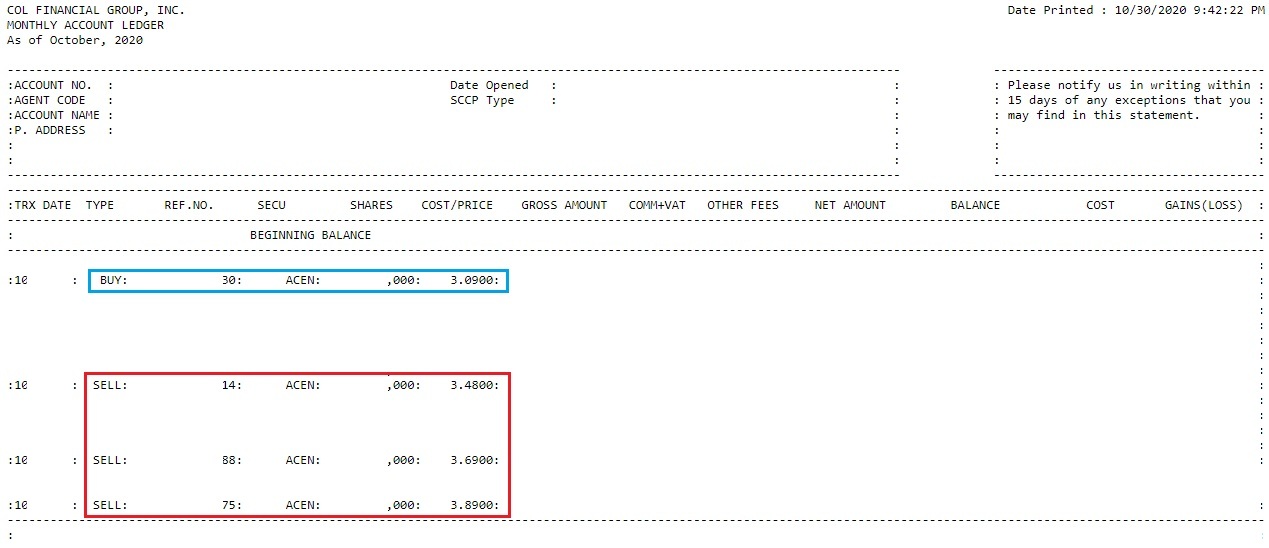
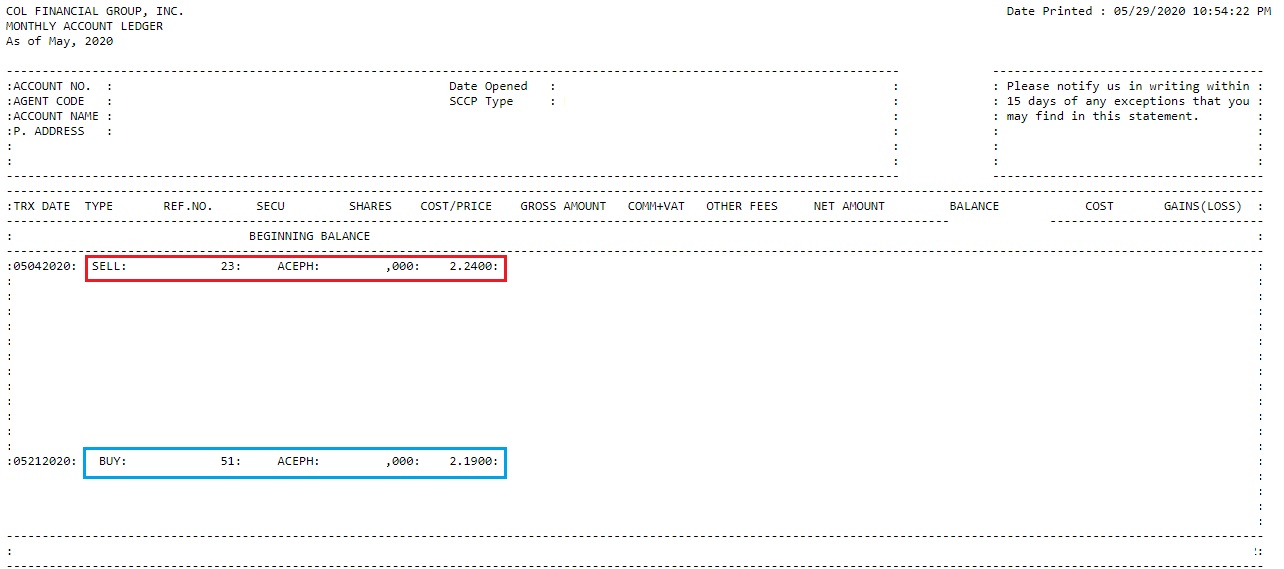
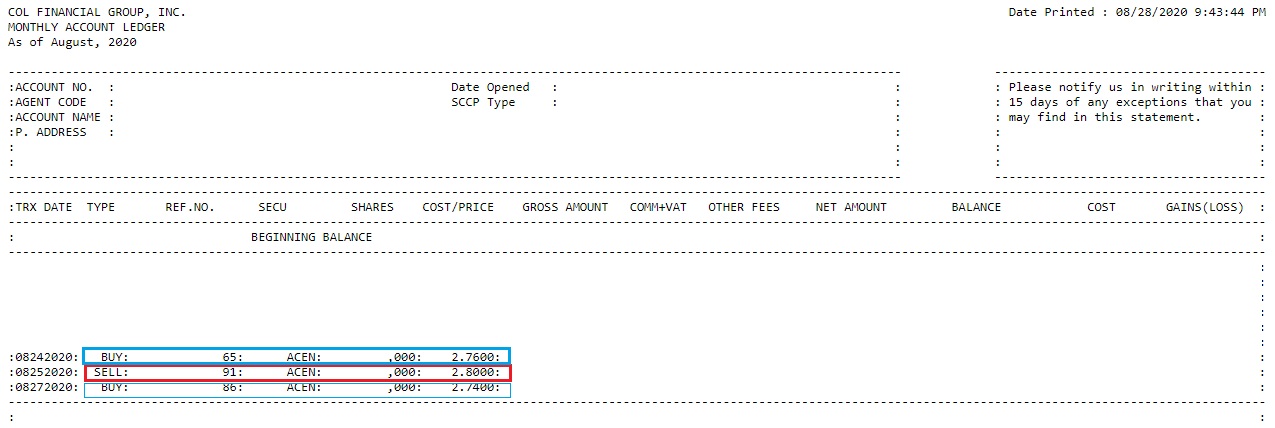
During these consolidation periods (box 1 & 2 above) I myself is impatient as I only took advantage of its short swings before I decided to get back in box 3 before a breakout and slowly sold in tranches.
Ledger May
 |
| ACEN_ledger_history_October2020 |
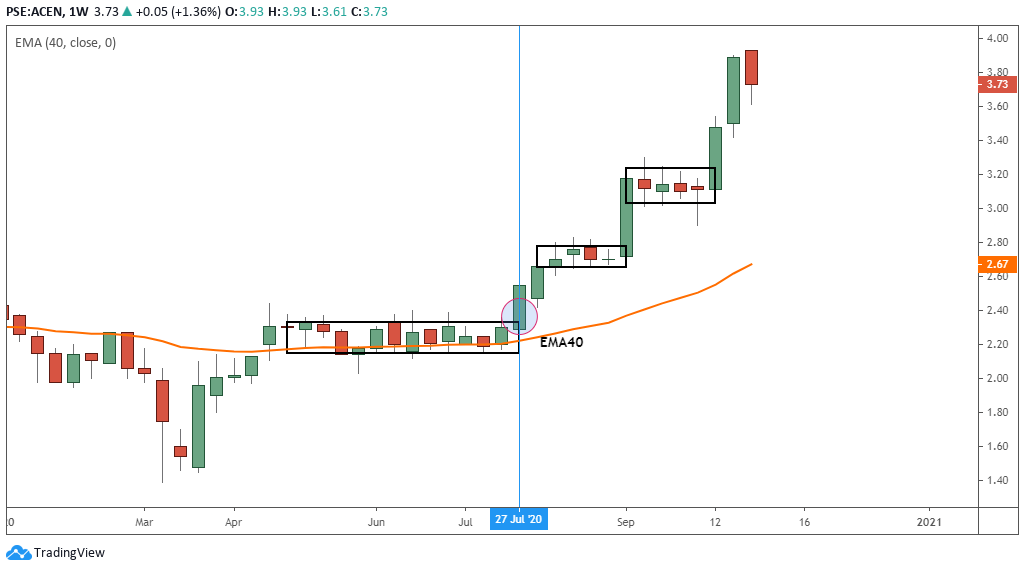
I do sometimes miss out to confirm from my weekly to check for breakouts with an EMA40 so I could have hold a little bit longer instead of selling, lucky I was given another opportunity of a consolidation in October.
 |
| chart_from_investagrams_ACEN |
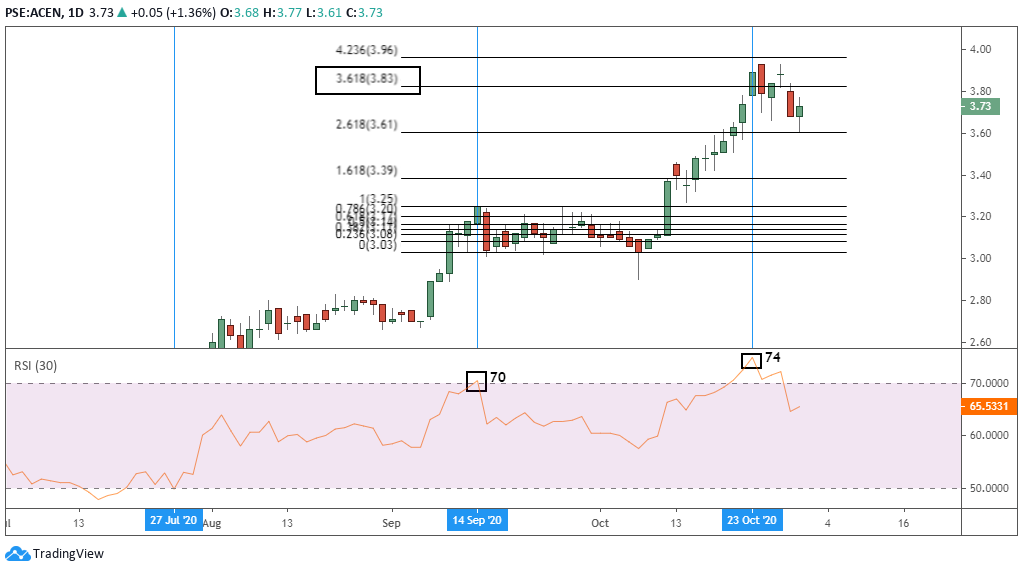
Going back from its daily time frame with the help of RSI, we can see it failed to go into parabolic state but maintains above 50 as it consolidated.
With the help of fibonacci I was able to get an idea of a target price which I set via GTC and looking at its RSI the next day it failed to move further above 75 to 80 which we can assume that it has reached its toppish level and wait for another chance if it goes back to parabolic state.
 |
| chart_from_investagrams_ACEN |
You need to wait for another strong support (from daily/weekly) and if it trades on sideways (consolidate) before you make another entry or observe if it will make 15-20% corrections before you decide to make another comeback.
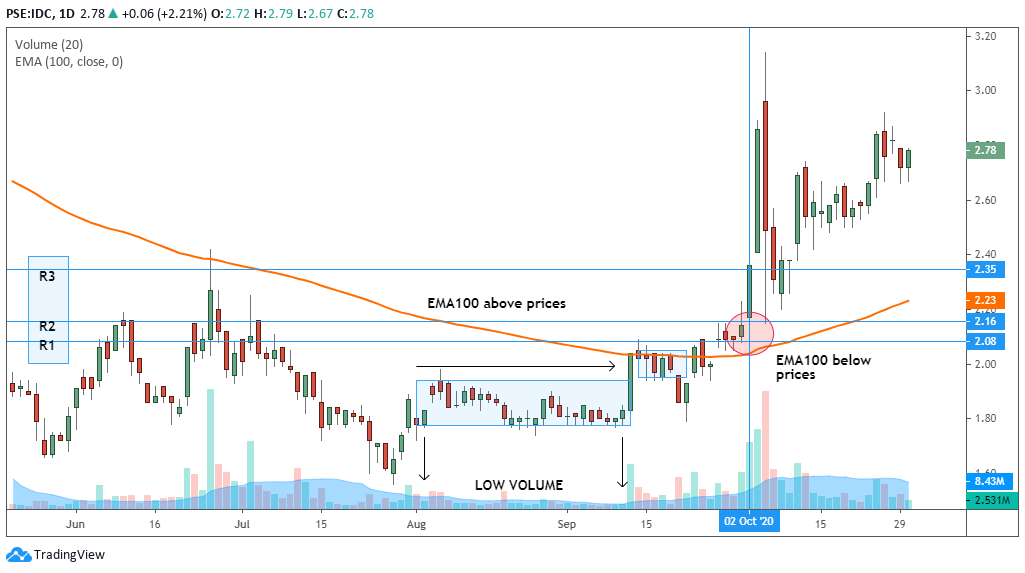
STOCK: IDC
➤early birds started to accumulate while EMA100 still above prices with its first breakout but could not complete to break R1 (Resistance 1)
➤with EMA100 touching prices could already signal a reversal but sometimes it could fail so best to check with your weekly with EMA40 should also be near the prices already.
➤finally breaking the three resistances 1 to 3 with volume on October 2, 2020
➤knowing IDC you should always be on guard on its breakouts as I mentioned above to make a habit to always start to take profit on succeeding candles after the B.O. but if you were able to pick during its conso stages then you won't bother much with the sell off after the breakout
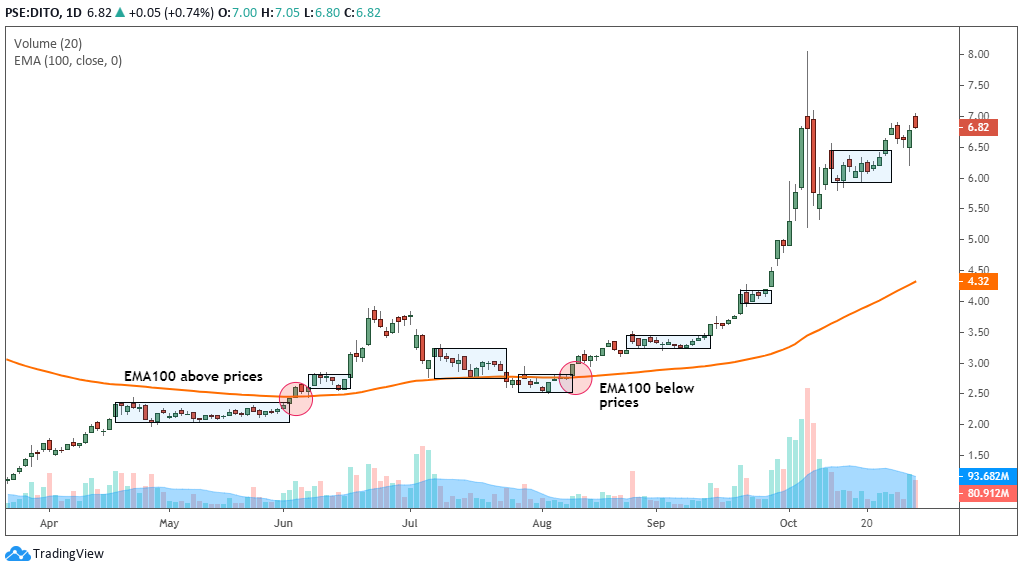
➤look how small and short the candles are with EMA100 below prices, at first it may fail so best to check from weekly for added conviction
➤on its first attempt that previous high became the basis for resistance for the second attempt to break which when you try to check its weekly EMA40 materialized as your support
Try to pattern from above samples and check with other stocks if you can hunt consolidating stocks and confirm the strength of support from a weekly tf to avoid some shakeouts from daily.
Don't forget to confirm with RSI if on parabolic state and plot your Fibonacci to get possible target prices to sell.
I leave it up to you if you can come up with a more better set up to hunt your dormant stock as this is only to give you an idea on how to start with combinations of time frames, moving averages, RSI and Fibonacci.
Happy hunt!
Share if you find this helpful.




0 Comments