A QUICK OVERVIEW HOW TO START
“If you’re only trading for the sake to pay your bills or expenses? Don’t do it.”- Edmund Lee
“If you’re only trading for the sake to pay your bills or expenses? Don’t do it.”- Edmund Lee
Trading Platform
Get an online broker
Get an online broker
To get started you must apply for an online broker of your own choice and make sure you have a TIN number to be qualified. A complete list of online broker can be found in PSE. You may download forms from respective sites, fill up then submit and wait for approval.
Fund your account
Once you got approved simply fund your account with the amount you are willing to invest and make sure it's your excess or extra money not allotted for your emergency or expenditures daily. Most online brokers have their respective minimum requirement of funds to start with.
Most online brokers have their respective minimum requirement of funds to start with like 1K, 5K, 25K up to 100K and so on except for Bank affiliated brokers like FirstMetroSec and BDO Nomura with zero initial fundings as long as you have an account with their banks but you need to fund your account anyway since you won’t get started to set your buy orders without any buying power/funds.
Most online brokers have their respective minimum requirement of funds to start with like 1K, 5K, 25K up to 100K and so on except for Bank affiliated brokers like FirstMetroSec and BDO Nomura with zero initial fundings as long as you have an account with their banks but you need to fund your account anyway since you won’t get started to set your buy orders without any buying power/funds.
If you manage to accomplish the two requirements of having an online broker and funding your account then the real deal is just about to start. Why online broker? To have full control of your account in buying and selling your shares and can be done with your mobile/laptop/pc as long as you have internet connection.
Stock Trading Hours
Trading time
Trading is from Monday to Friday except holidays and starts at 9:30-12:00 Noon and resumes from 1:30 to 3:30 PM. You may start memorizing some stock codes or symbol that will be beneficial when using charts. Start with the blue chips that make up our index and memorize its stock code or symbol name here.
Trading is from Monday to Friday except holidays and starts at 9:30-12:00 Noon and resumes from 1:30 to 3:30 PM. You may start memorizing some stock codes or symbol that will be beneficial when using charts. Start with the blue chips that make up our index and memorize its stock code or symbol name here.
Technical Analysis
Introduction to Charting
Introduction to Charting
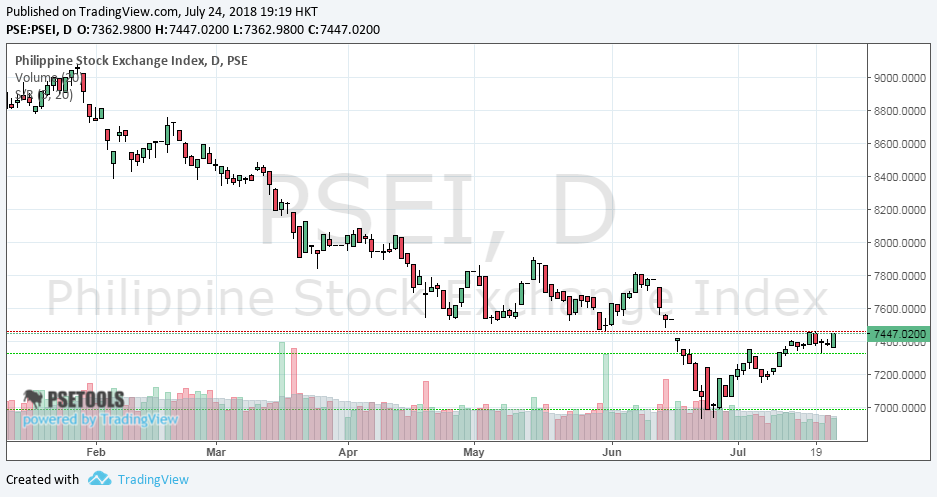
Every online broker has its own charting tools but you may also use other online charts. Simply open and it should look the one below. Sample chart from PSE_tools*
*no longer available
 |
| PSE_charting_tool_by_PSETOOLS |
Here’s a short video (14-15min) on how to play around with your charts on adding indicator, setting up, changing its color, value and much more, etc (here) or in this post.
The PSEi is just your overall view on how our market performs that comprise the different sectors amidst the global issues and political factors within the country that may affect each stock prices.
What you see above are candlesticks that represents your prices which can be modified to bar, lines, area etc depending on your own preference, color green means price close higher from its opening price (positive) and red candles indicates price went lower from its opening price (negative) and for the candles with almost thin line with no body recognized means traders are undecided.
Personally I’m not fond on candlestick patterns but you may try to study them yourself like doji, hammer those kinds of stuff, as long as I see if it's green, red and where the wick is located and how long it is, I already have an idea what happened during a trading day.
Supply and Demand
Two Major Levels to consider(a MUST!)
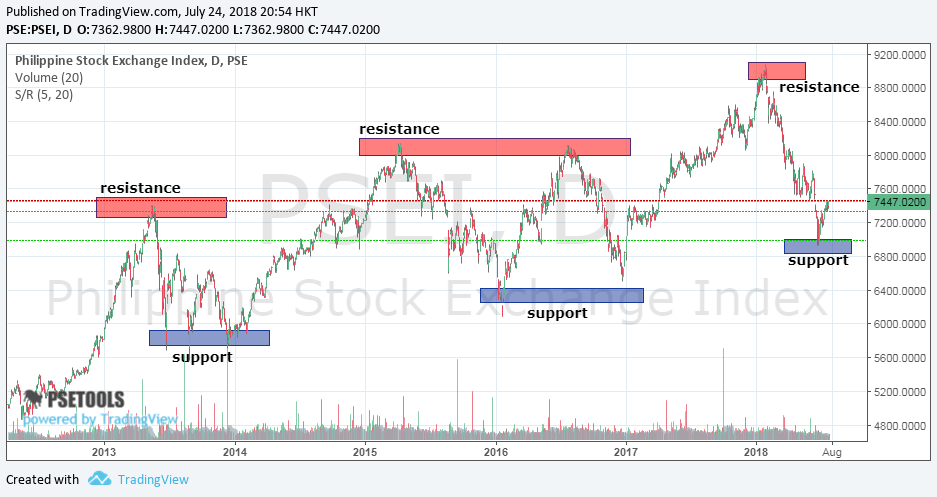
Now that you know that what you see from chart are prices you must now remember these two levels, your support and resistance. These points where price suddenly stop and move towards the other direction are your key levels to either buy or sell your shares (wait for a strong base if buying near support levels.).
➤Support when there are more buyers than sellers preventing the price to drop further will initially push the price higher.
➤Resistance is your level when there are more sellers than buyers preventing the price to move higher and tends to push the price lower. See sample chart below to get an overview.
 |
| chart_from_PSETools_support_&_resistance |
Just take note that a Support can become a Resistance and Resistance can also become your Support level depending on the trend of the market.
Whatever indicators you will add to your chart like moving averages, Fibonacci, ichimoku, bollinger, rsi etc you will still be focused on support and resistance where you will initiate your buy orders and sell orders and this applies to any stocks in the market.
Two Ways to Earn
How to make money in the Market
Basically the concept to make money in the market is "buying low" (along support) and "selling high" (along resistance) but if you will master your system you can also apply "buy high" and sell higher (average up).
Aside from appreciation you may also earn from dividends for a particular stock that pays out yearly as long as you are holding the stock before the ex-dividend date then you are qualified to receive dividends either in cash or stocks depending on the company who issues such dividends yearly.
Don’t forget also that there are crooks who will try to manipulate some low float stocks so please stay away from hyped stocks if you’re not quick enough to exit your positions if you don’t have a trade plan, you have been warned.
There are good side and bad side of the market so it can't be helped when these manipulations happens just stay sharp and don’t be a victim.
The Market Sentiments
Learning the current Trend
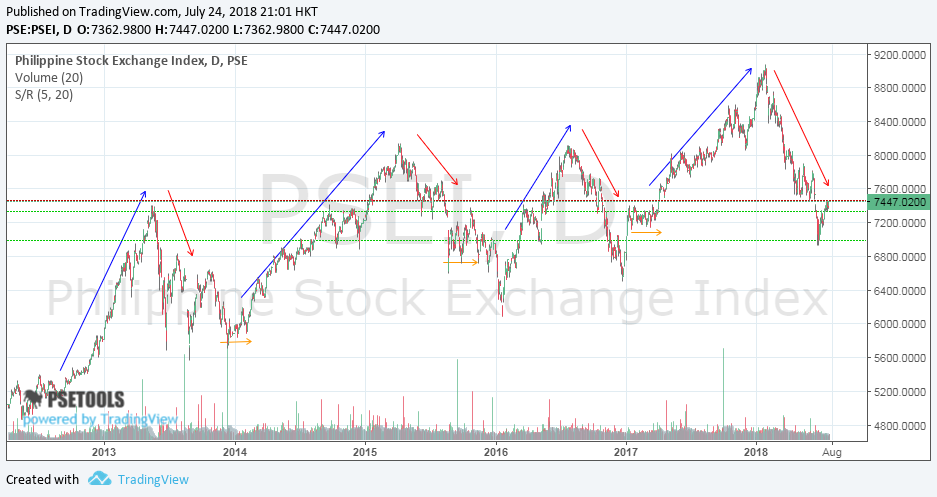
After learning support and resistance you must at least be aware of the trend of the market as it does not move on a straight line but consists of three movements such as upward movements, downwards and on horizontal range.
 |
| chart_from_PSETools_market_trends_Pse_tools |
When price going up they call it as BULL trend, when price going down called as BEAR trend, and price on horizontal range called as SIDEWAYS or in Consolidation.
It's always a rule to know the current trend of the market to know your best plan on where would be your possible support and resistance.
The Edge
How to know the trend? This is where your indicators comes in and you may use simple moving averages like MA50, MA100, MA200 or Bollinger bands.
The Edge
How to know the trend? This is where your indicators comes in and you may use simple moving averages like MA50, MA100, MA200 or Bollinger bands.
Samples only
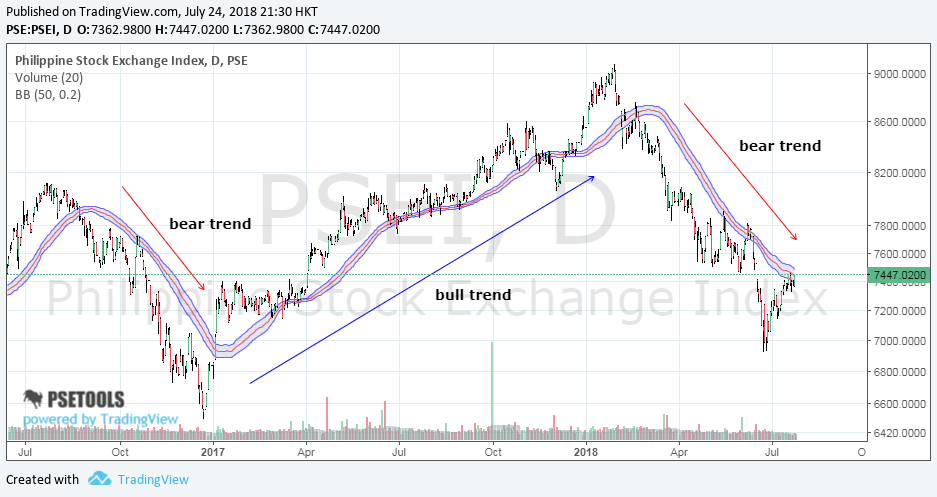
Using Bollinger Bands
➤when bollinger above your prices is Bear trend (serves as Resistance)
➤when bollinger below your prices is Bull trend (serves as Support)
➤when bollinger above your prices is Bear trend (serves as Resistance)
➤when bollinger below your prices is Bull trend (serves as Support)
 |
| chart_from_PSE_tools_bollinger_bands_(50,0.20)_PSE_tools |
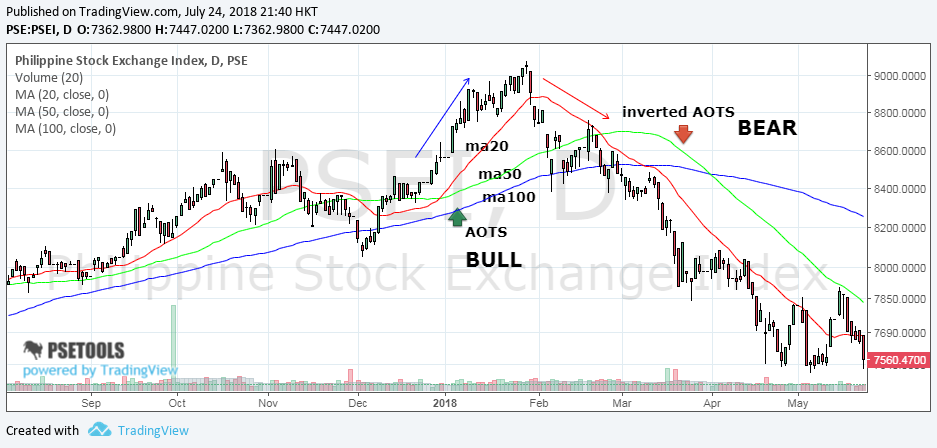
Using AOTS
➤when MA20>MA50>MA100 signals a Bull trend
➤when AOTS is inverted signals a Bear trend
➤when MA20>MA50>MA100 signals a Bull trend
➤when AOTS is inverted signals a Bear trend
 |
| AOTS_formations_PSE_tools |
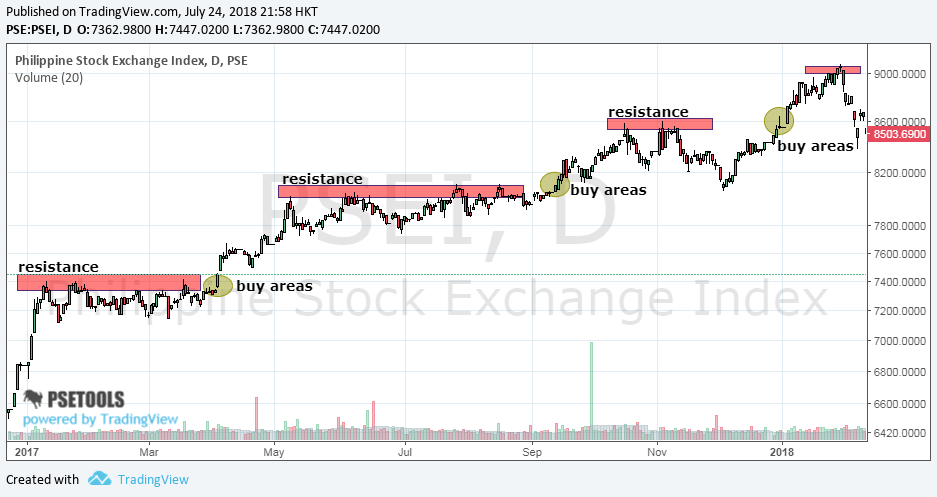
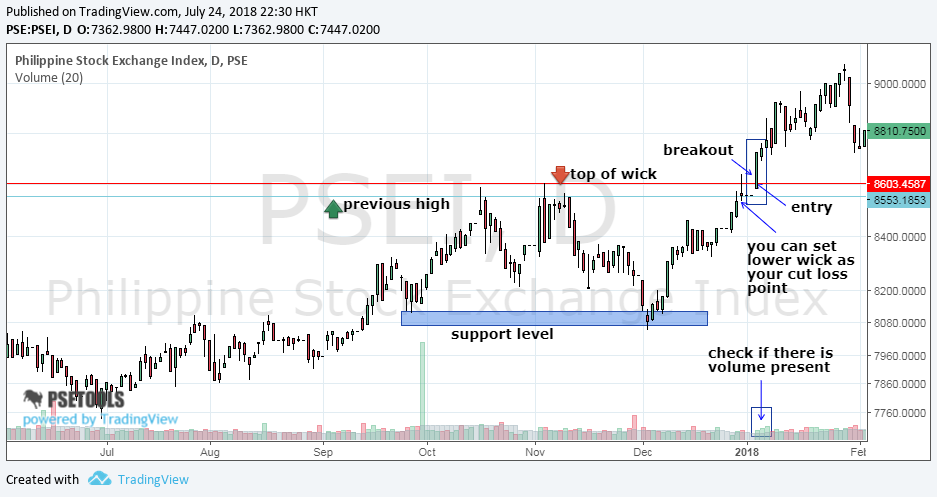
Scout stocks that always break its previous high and creates new sets of highs, once it break start to position yourself and set your cut loss just below your entry points depending on the amount you wish to risk if the market go against you.
Below sample is simply on Bullish trend whether you're a trader or investor you will set your entry points after it breaks from its previous high (resistance) to add up shares and sell from next resistance or simply adding up shares for every breakout and follow the trend until it ends.
Below sample is simply on Bullish trend whether you're a trader or investor you will set your entry points after it breaks from its previous high (resistance) to add up shares and sell from next resistance or simply adding up shares for every breakout and follow the trend until it ends.
 |
| all_new_high_PSE_tools |
With your entry points from the breakout from previous high make sure to add some cut loss levels to manage your risk if in case there is a fake out. Always confirm if there is great Volume involved during the rally else the breakout will be cut short.
 |
| breakout_plays_PSE_tools |
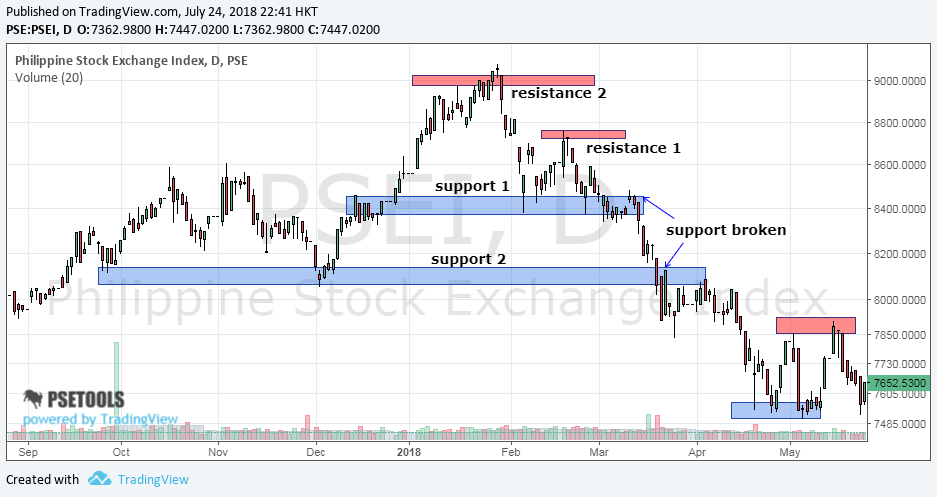
While playing on Bear trend would put your skill to the test to spot on support and short rallies to make some profits.
 |
| bear_trend_PSE_tools |
Over and over whatever stock you will trade/invest you will still be prompted to go back and spot support and resistance levels even to what type of trend the market has to offer.
That's the very basic reason why you need to know the trend to have an idea where the market is creating its support levels or resistance levels where you can plan your entry and exits.
That's the very basic reason why you need to know the trend to have an idea where the market is creating its support levels or resistance levels where you can plan your entry and exits.
Price is King
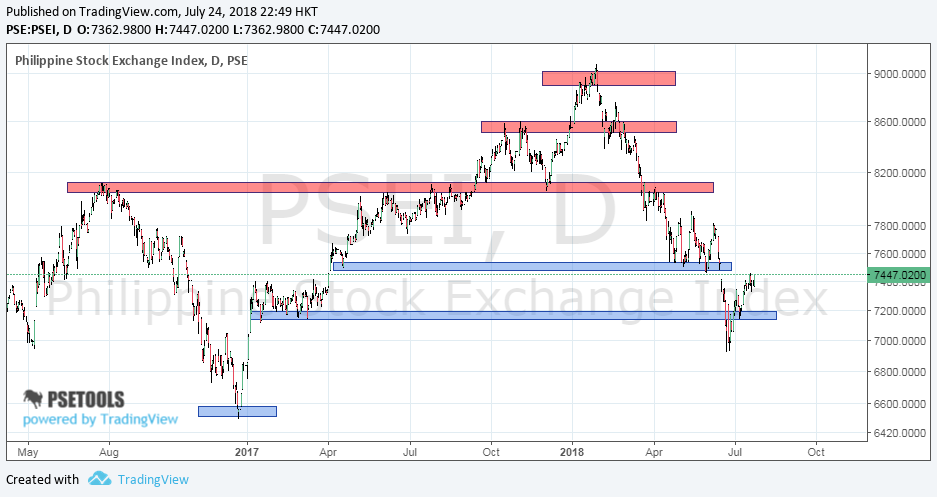
With the price action from your chart you can already set up your support and resistance levels without the use of other indicators/oscillators like MACD, moving averages, stochastic, RSI etc.
With the price action from your chart you can already set up your support and resistance levels without the use of other indicators/oscillators like MACD, moving averages, stochastic, RSI etc.
 |
| price_action_PSE_tools |
The price speaks up for itself, it already shows you how each and everyone has reacted to the market in terms of news, hype, catalyst etc. Other mentioned indicators/oscillators are just confirmations but actually derived from prices so it will just depend on your own style.
What I like on moving averages like MA100 would give you an overview how long it will be on a particular trend if it's Bullish or Bearish especially on Weekly Time frame until prices breakout or breakdown from this level.
note: when in weekly use MA20 as equivalent to MA100 in daily since in weekly you have 5 days trades in a week.
Adding some fundamentals by reading from disclosures on PSE for a particular stock would strengthen your conviction if the company is gaining via its annual reports which are basically factors for other traders/investors who might be interested if the company is earning and not losing.
To summarize, the stock market revolves with price going up, going down and sideways (in any order) as it will always depend on how the market reacts to a given stock.
Learn first the macro environment of your chosen stock at a bigger scale (like Weekly) then that's the time you will go into details on the micro (like Daily) where you will use other indicators to confirm your planned entries or exits.
Apply risk management to protect your capital and you will stay in the game. Focus on the process not on the profits. Set some trail stops to protect your profit and set some stop loss to protect your capital.
If you don’t have time to trade and just be an investor I would still suggest you to learn how to read charts and not just try to buy stocks based from what your gurus, brokers, friends tells you.
Learn to spot support levels where you can add positions to your current stock at hand as long as the overall trend shows you an uptrend, and not buying at the top going down.
If you are trading with emotions better not play this game if you're not yet psychologically prepared even so called long term investors got burned if they don’t know how to exit their positions when the market hits badly.
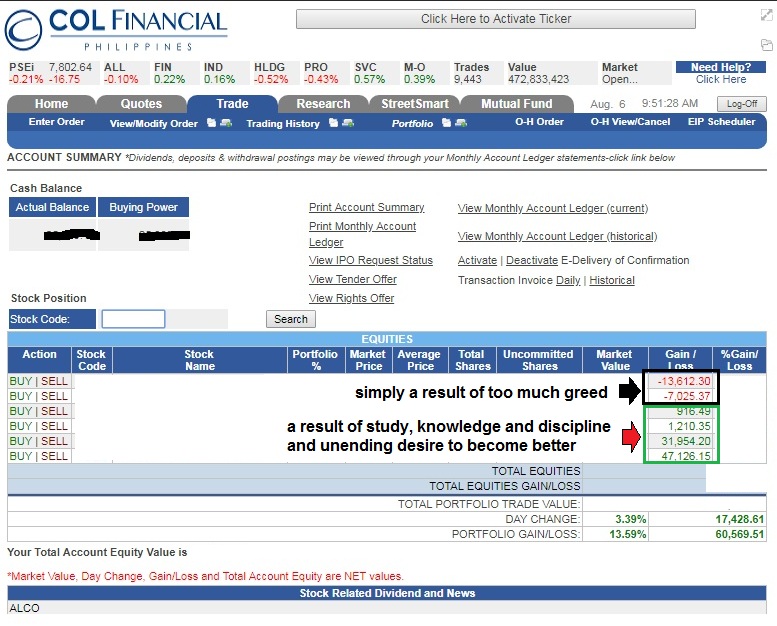
Greed is good as long as you know when to apply it properly, if you desire for more knowledge then that would benefit you in the long run but if you desire for the price to rocket even when the market is already telling you it's going down, then that’s another story.
 |
| Greed_for_gains_vs_greed_for_knowledge_COL_Financial |
To add up if you read companies with disclosures where Directors are buying shares means a positive signal for traders and investors while when you read directors disposing their shares would project a negative impact.
Take note that TA, FA are just your tools to help you increase your odds to win your trades as there are hidden variables that you can't see and you must be able to act objectively if in case it goes against your favor.
There are no guarantees that both will work but will somehow give you an edge against to those who doesn’t plan their trades at all.
You can't dictate the flow of the market, if it goes against you it tells you that's the sentiment of the majority and doesn’t care about what you think or justification you present to prove you are right.
Accept failure and learn from it, without failures you will never know if you are doing the right thing and risk in the market is unavoidable and you can never escape it just live with it and focus on having a winning attitude.
Disclaimer: No one can predict the market and that is a fact and you must accept that anything can happen!...but you can get a piece of reward from the market with proper risk management and with the proper MINDSET.
There is money in the market only if you set your own goals and that distance to make it a reality is just within your fingertips if you put some ACTION, doing nothing after reading and learning is totally a waste.
Hope from this you already got a bigger picture how the market works and how you will take advantage to make some profits, no matter what indicators you will be using you will always be referring back to support and resistance levels.
Don't forget to share if you find this helpful.
Good luck to your stock market journey!


0 Comments